Economy

Until the Pips Squeak

Article #479

Squeezing the lemon

During the December 1918 election campaign, Sir Eric Geddes promised to squeeze Germany until you could hear the pips squeak [1]. Germany never paid anything like the bill. Squeezing is easy to promise. The juice is another matter.

More than half a century later Denis Healey borrowed the image. In Lincoln in February 1974, as Labour's shadow chancellor, he promised to squeeze property speculators until the pips squeaked. The press turned that into squeezing the rich, and the line has stood for the rich in general ever since [2].

Labour had committed itself to a wealth tax. Healey spent five years as Chancellor trying to design one. Looking back in 1989, he admitted he could not draft one that would raise enough revenue to be worth the administrative cost and the political hassle [3].

In the meantime Britain ran out of money. On 28 September 1976 Healey was at Heathrow, bound for the IMF annual meetings, when sterling slid. He turned back to the Treasury and announced that Britain would seek a record $3.9 billion loan. The Letter of Intent, signed on 15 December, committed the government to deep cuts in public spending [4][5].

The squeezer had become the squeezed. Within three years of promising to squeeze the speculators, the Chancellor was negotiating terms with Britain's creditors. It is worth remembering as New Zealand heads to the polls on 7 November.

What is on the table

The Green Party proposes a 2.5% annual tax on net assets above $10 million, covering property, shares and bonds, with the family home exempt. Alongside it sits a 33% capital acquisitions tax on inheritances and gifts worth more than $1 million, paid by the person receiving, with family homes and family farms exempt [6].

The revenue would fund a $10,000 tax-free threshold and a 45% top rate above $160,000, which the Greens say would cut tax for 96% of New Zealanders [6].

They are not alone. Te Pāti Māori want a targeted wealth tax on the wealthiest 3%, at 1.5% on net assets above $2 million, 2% above $5 million and 2.5% above $10 million [7]. Opportunity proposes an annual land tax of 1.75% on urban land and 0.5% on rural land [8]. Same instinct, different coat. Across the left, the reach is for a levy on what you hold rather than what you receive.

And here is the irony. Opportunity is the kingmaker in the latest 1News Verian poll, on 8%, so its plan is not idle talk [9]. Yet Gareth Morgan, who founded the party now called Opportunity, argued on 10 October that “Wealth taxes kill entrepreneurship” and called the tax plans of Labour, the Greens and now Opportunity regressive for New Zealand [10]. The man who once campaigned to rid the country of cats now seems keen to see off his own creation.

Who could deliver it

Before anyone panics, a reality check. National, ACT and NZ First oppose wealth, inheritance and comprehensive capital gains taxes [11]. Labour has ruled out a wealth or inheritance tax. Its own centrepiece is a 28% tax on gains from the sale of investment and commercial property, excluding the family home, applying only to gains made after 1 July 2027 [12].

Under MMP, the Green package could only arrive as the price of a coalition, and then only in whatever form the negotiation produces. Election night tells you the direction. The coalition talks tell you the substance.

A valuation is not cash

There is a hard truth under all of this. A wealth tax is levied on a valuation. It is paid in cash.

Take an owner with $20 million of net assets, most of it a business built over two generations. Under the Green rules the first $10 million is free. The second $10 million attracts 2.5%. That is $250,000 a year, every year, due whether the business had a record year or a bad one. The business does not pay it. The owner does, from income already taxed, from borrowing, or from selling a slice of the thing that employs people.

A lower threshold bites harder. Take a family company worth $14 million, with the family home left out. The Greens tax the $4 million above their line, which is $100,000 a year. On Te Pāti Māori's published tiers, treating each band as a marginal rate, the same company faces about $245,000 a year. Their published summary leaves open whether the family home counts towards the $2 million base.

Then someone has to value it. Listed shares are easy. So, mostly, are an orchard or a commercial building in Hastings, because a valuer can work from recent sales. A private trading company is not. Nor is a minority shareholding in a family business or a partnership interest. Every annual valuation is an argument with Inland Revenue waiting to happen.

As the old line goes, you may call a cat a fish, but it can’t swim. You may call a valuation wealth, but it can’t pay the bill.

The Greens’ own costings assume 28.5% of the super-rich tax is never collected, lost to avoidance and minimisation, on advice from the Parliamentary Library informed by Treasury [13]. When the people designing a tax concede that more than a quarter leaks away before it starts, the rest of the brochure is a wish.

The proposed inheritance tax has the same flaw in a different coat. Because the person receiving pays, a son or daughter who inherits a $3 million share of a family business could face a bill in the hundreds of thousands of dollars. The asset does not come with that cash attached.

The scoreboard

The OECD found 12 member countries had a net wealth tax in 1990 and only four by 2017. Repeals were usually justified on efficiency and administrative grounds, and the taxes often failed to meet their redistributive goals [14].

Norway is the case study everyone reaches for. In 2022 a rise took its top combined rate to 1.1%. That year more than 30 billionaires and multimillionaires left, according to Dagens Næringsliv [15]. Capital has legs. Its owners have passports.

The Netherlands has just learned the same lesson the quick way. In February the lower house passed a law taxing the annual rise in value of shares, bonds and crypto at 36%, whether or not anything was sold. A petition gathered more than 61,000 signatures and coalition senators preferred a tax on sale. The cabinet has now proposed taxing shares and bonds only when they are sold, from 1 January 2028 [16]. Tax the cash, not the valuation.
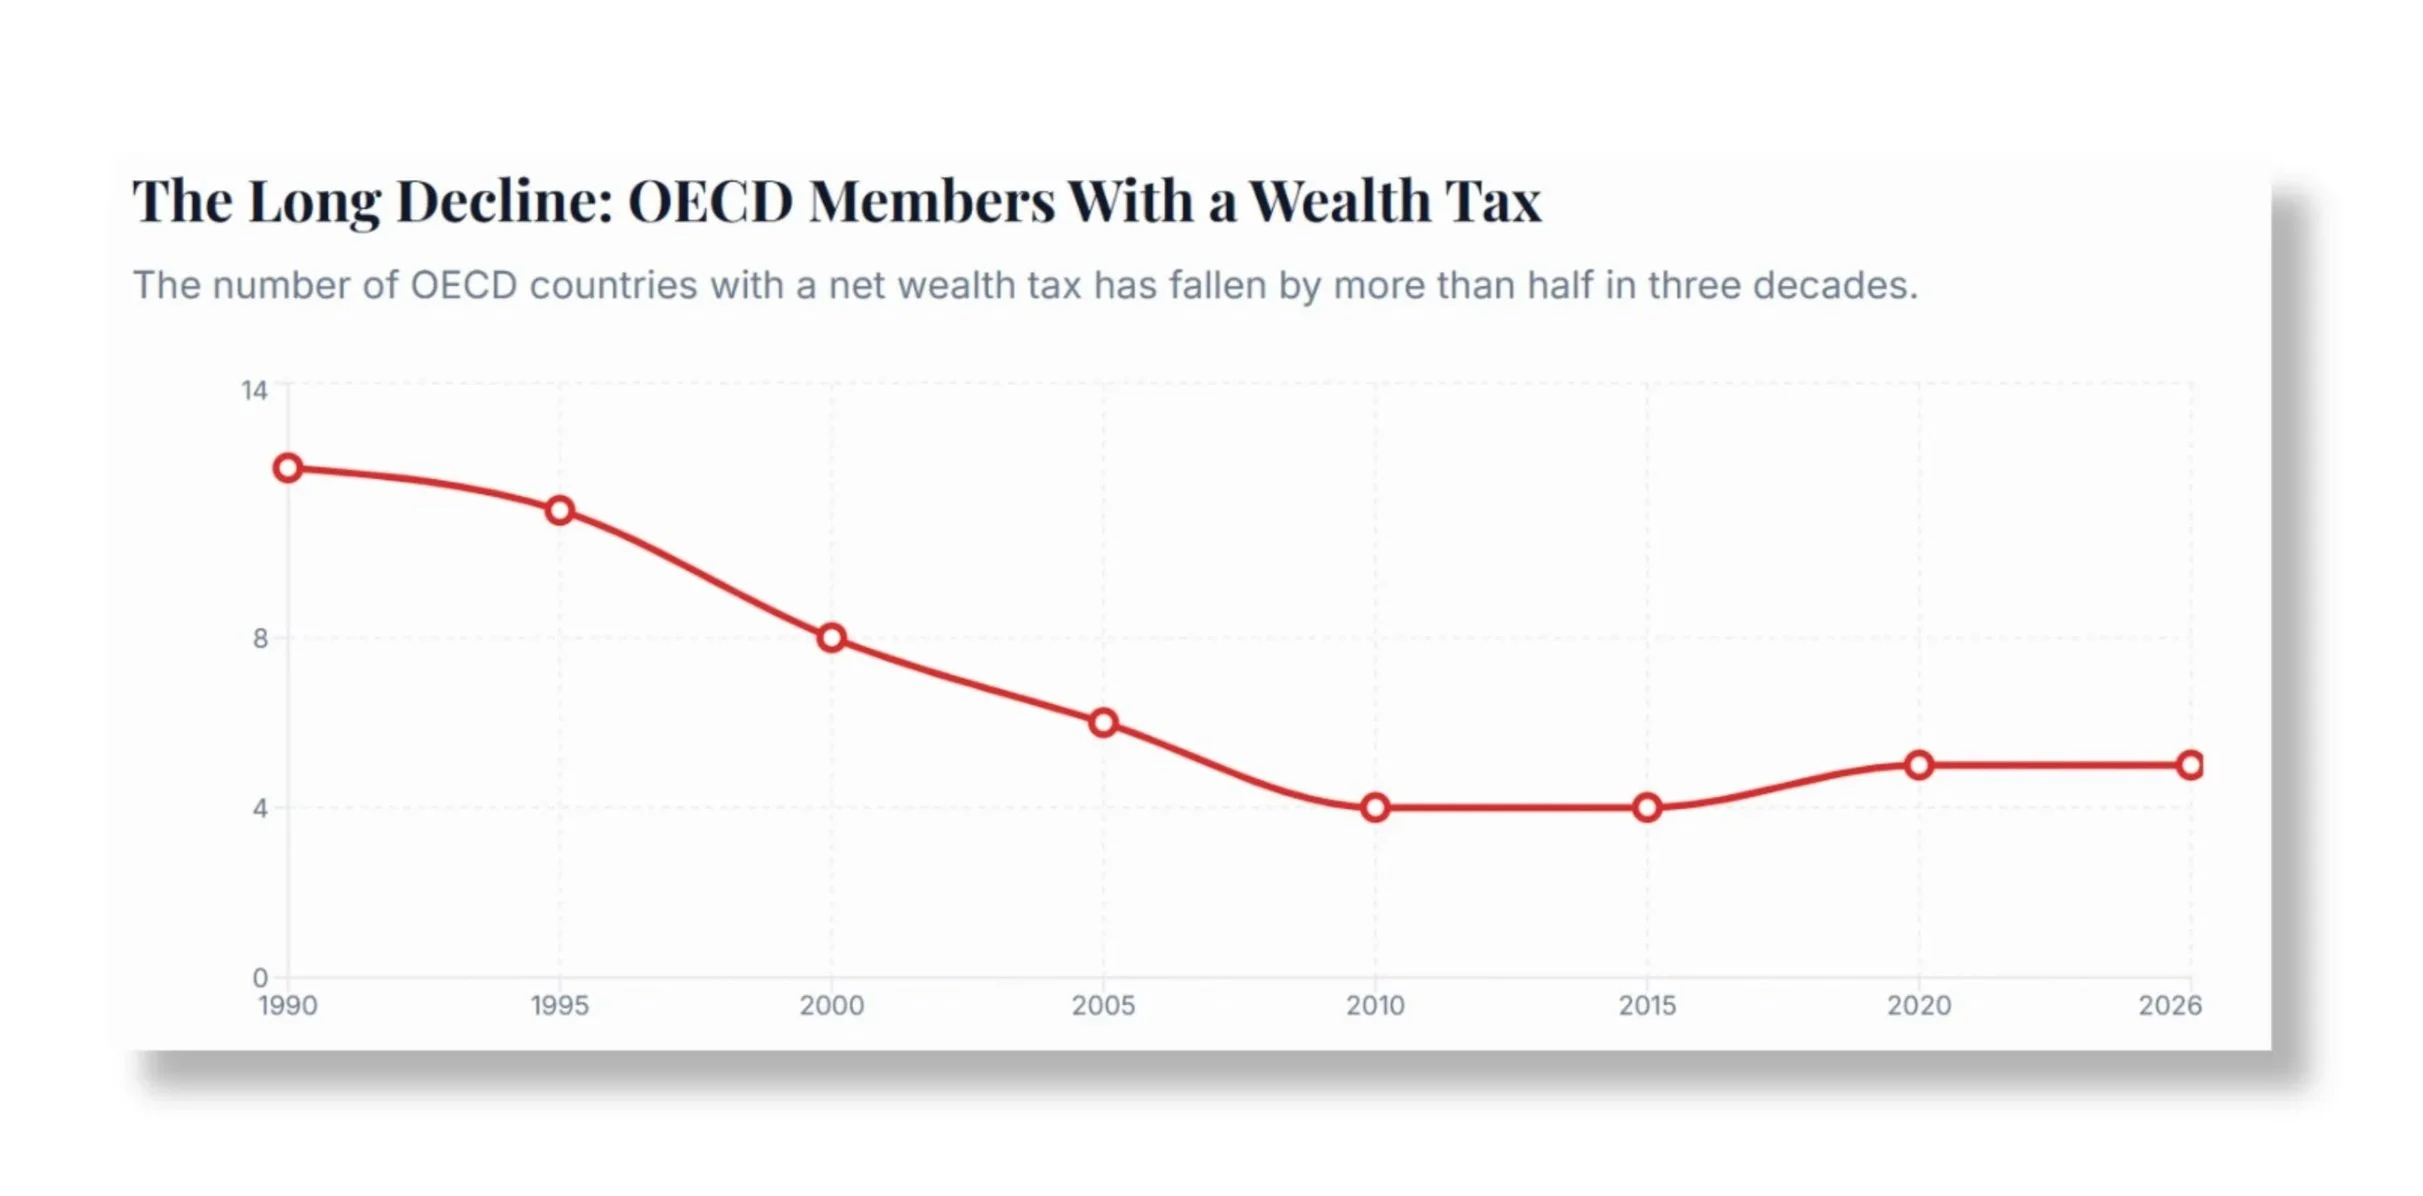
Source: Regen-Fin

The grain of truth

The counter-case deserves a fair hearing.

New Zealand has no general capital gains tax and no inheritance tax [11]. A salary earner pays tax on every dollar from the first. A long-term property or share investor can see large gains taxed lightly or not at all. That is a genuine gap, and these parties are at least trying to fill it with a number rather than a slogan. The OECD itself accepts that where capital is lightly taxed, or inheritances are not taxed, a net wealth tax may play a substitution role [14].

The administration case is not all one way either. Research in Fiscal Studies puts the central cost of running a well-designed UK wealth tax at about 0.1% of taxable wealth for taxpayers and 0.05% for the tax authority [3]. That counts the cost of collecting the tax, not the cost to the owner of finding the cash.

But a wealth tax is the hardest tool for that job. A capital gains tax is levied when cash changes hands. Even Labour's narrower version bites only on sale. A wealth tax is levied when it does not. It taxes the paper, year after year, and leaves the owner to find the money.

Whose interest is being served

For families, the practical question is not who you vote for. It is whether your structure works under more than one government.

Who holds what. How it would be valued, and by whom. Where the cash would come from in a lean year. Whether the succession plan still works if a 33% tax falls on the next generation. Whether a trust settled decades ago still serves the people it was meant to.

Do not restructure in a panic for a policy that may never pass. But do know your position, your structures and your succession plan before election night hands the file to a coalition room. Those are planning questions, and they are better answered calmly before a policy lands than in a rush after it.

Healey learned the lesson over five years. The pips squeaked, but it was the Treasury that ran out of juice. Grow the pie first, then argue about the slice.

Position for your goals, not for a caucus vote. When the noise gets loud, seek advice and wise counsel.


Nick Stewart

(Ngāi Tahu, Ngāti Huirapa, Ngāti Māmoe,
Ngāti Waitaha)

Financial Adviser and CEO at Stewart Group

  • Stewart Group is a Hawke's Bay and Wellington based CEFEX & BCorp certified financial planning and advisory firm providing personal fiduciary services, Wealth Management, Risk Insurance & KiwiSaver scheme solutions.

  • The information provided, or any opinions expressed in this article, are of a general nature only and should not be construed or relied on as a recommendation to invest in a financial product or class of financial products. You should seek financial advice specific to your circumstances from a Financial Adviser before making any financial decisions. A disclosure statement can be obtained free of charge by calling 0800 878 961 or visit our website, www.stewartgroup.co.nz


References 

1. Langworth, R. (2014). Squeeze Germany until the pips squeak. Churchill Project, richardlangworth.com. On Sir Eric Geddes, First Lord of the Admiralty, and the 1918 election. The Cambridge speech of December 1918 is recorded at phrases.org.uk.

2. Healey, D. Speech at Lincoln, 18 February 1974, reported in The Times, 19 February 1974 (as quoted in Wikiquote: Denis Healey). Often misreported as “tax the rich until the pips squeak”. See also LabourList (October 2015), 10 of the best Denis Healey quotes.

3. Burgherr, D. (2021). The costs of administering a wealth tax. Fiscal Studies, 42(3-4), 677-697 (quoting Denis Healey, 1989). https://doi.org/10.1111/1475-5890.12276

4. Pickford, S. (9 December 2016). Britain’s big bailout, December 15, 1976. The World Today, Chatham House.

5. OMFIF (28 September 2016). When Britain went bust. https://www.omfif.org/2016/09/when-britain-went-bust/

6. 1News (21 June 2026). Greens propose wealth, inheritance taxes to fund income tax changes. https://www.1news.co.nz/2026/06/21/greens-propose-wealth-and-inheritance-taxes-to-fund-income-tax-changes/

7. 1News (26 August 2026). Te Pāti Māori launches new tax policy, says most would pay less. https://www.1news.co.nz/2026/08/26/te-pati-maori-launches-new-tax-policy-says-most-would-pay-less/ and Deloitte New Zealand (September 2026). Election tax policies, part three.

8. Opportunity Party (May 2026). Tax Reset policy. https://cdn.opportunity.org.nz/documents/policy/Opportunity%20Policy%20-%20Tax%20Reset.pdf, and 1News (30 June 2026). Explainer: What are the Opportunity Party’s policies? https://www.1news.co.nz/2026/06/30/explainer-what-are-the-opportunity-partys-policies/

9. 1News (13 October 2026). Poll: Hipkins and Luxon now neck and neck, Opportunity on track for 10 MPs. https://www.1news.co.nz/2026/10/13/poll-hipkins-and-luxon-now-neck-and-neck-opportunity-on-track-for-10-mps/

10. Morgan, G. (10 October 2026). Opportunity’s tax plan joins Labour, Greens as regressive for NZ. Newsroom. https://newsroom.co.nz/2026/10/10/gareth-morgan-opportunitys-tax-plan-joins-labour-greens-as-regressive-for-nz/

11. KPMG New Zealand (August 2026). Election 2026 party tax policies tracker (updated to 6 August 2026), and Grant Thornton New Zealand (2026). Tax policy at the crossroads: growth, simplicity and redistribution in Election 2026.

12. Deloitte New Zealand (August 2026). Election tax policies, part two (Tax Alert), and interest.co.nz (June 2026). Labour finance spokesperson Barbara Edmonds says the only tax policy Labour will campaign on is its capital gains tax.

13. interest.co.nz (2026). Natalia Albert says finally the Green Party has mostly got its tax policy right (28.5% of the super-rich tax assumed uncollected, on Parliamentary Library advice informed by Treasury). https://www.interest.co.nz/public-policy/139129/natalia-albert-says-finally-green-party-has-mostly-got-its-tax-policy-right

14. OECD (2018). The Role and Design of Net Wealth Taxes in the OECD. OECD Tax Policy Studies No. 26. OECD Publishing, Paris.

15. IFC Review (April 2023). Europe’s super-rich abandoning Norway at record rate as wealth tax rises slightly (citing Dagens Næringsliv).

16. IMI Daily (16 September 2026). Netherlands retreats from 36% unrealized gains tax, will propose sale-based model instead; and DutchNews.nl (30 September 2026). The box 3 tax changes: what they are and what they mean for you.

Betting on the Wrong Team

Article #478

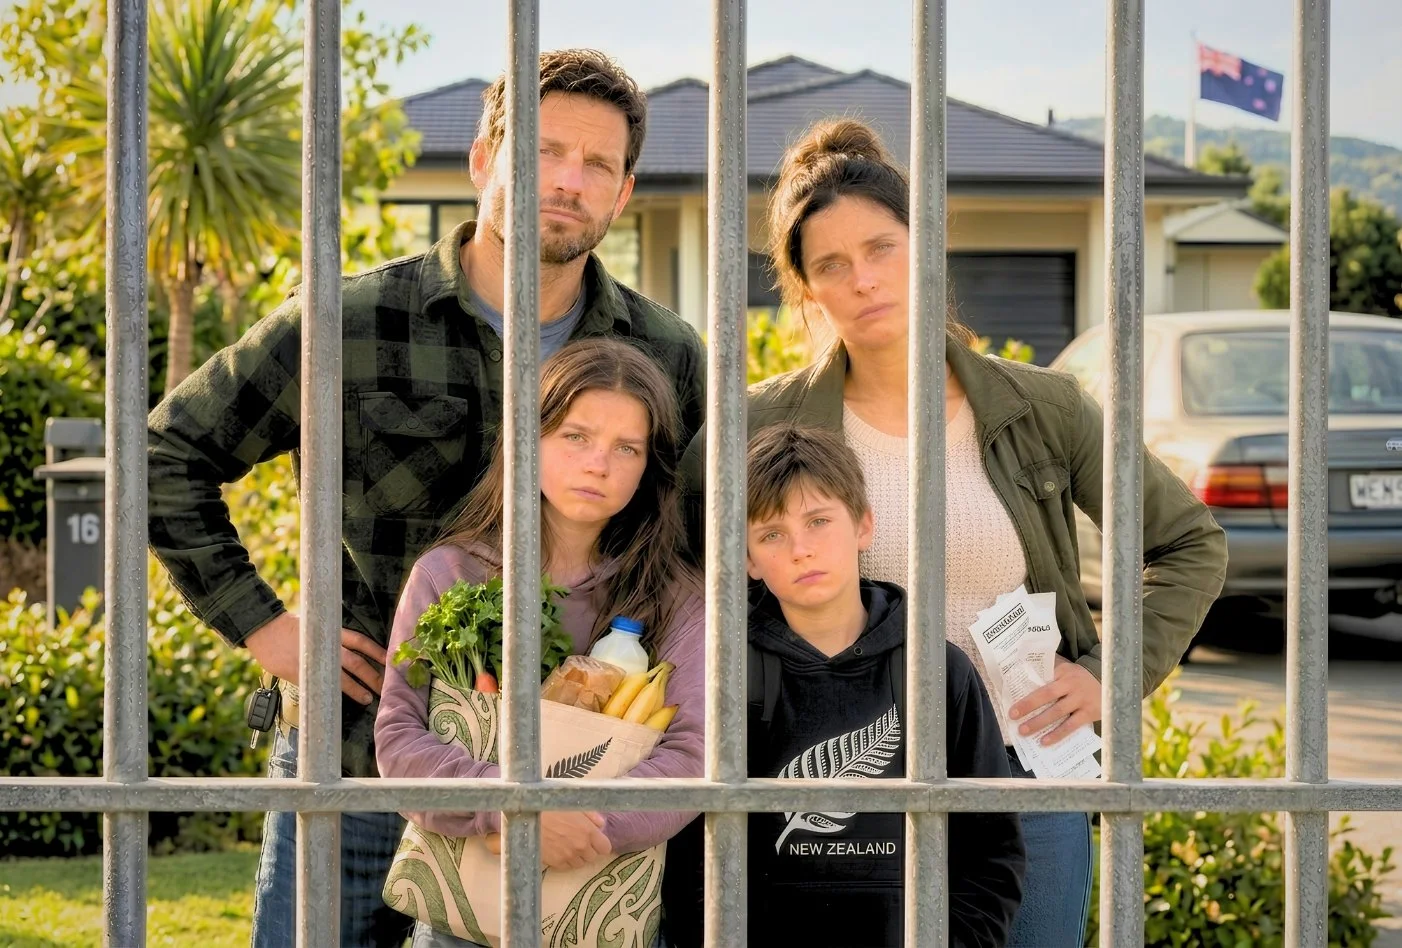
Buying in Christchurch because you can't afford Auckland sounds like a canny move. But renting where you live while your investment sits somewhere else carries a risk most people never properly account for.

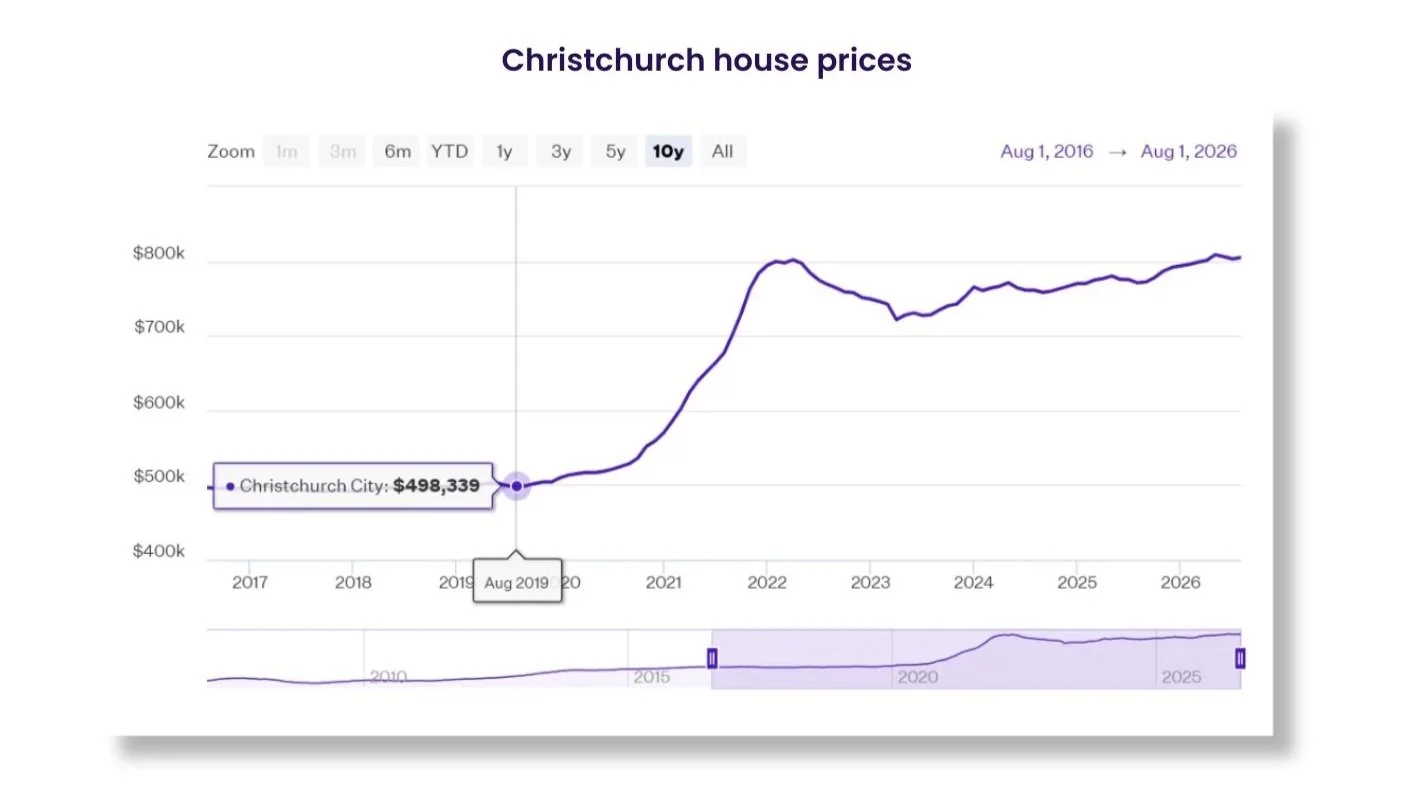
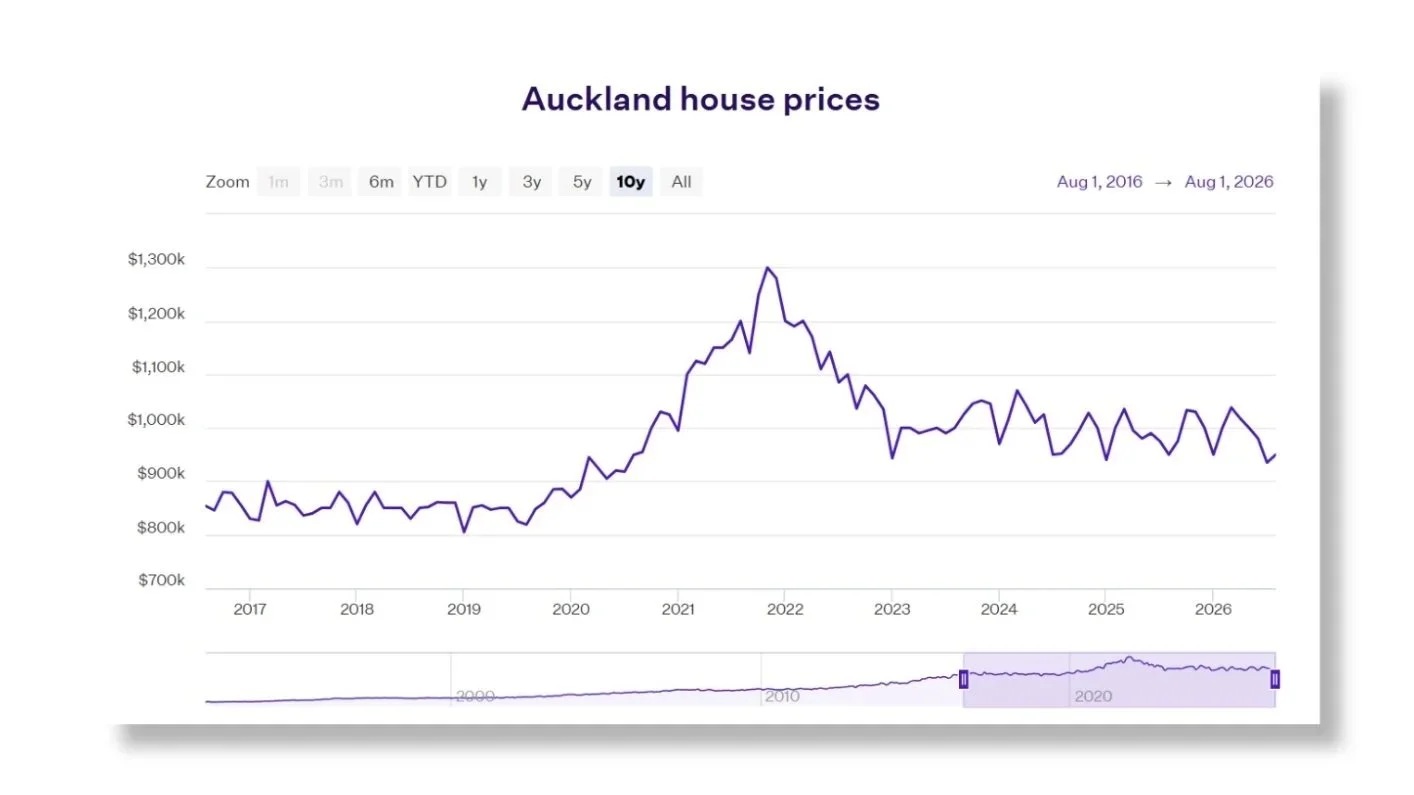
The logic is seductive, and on the surface it looks almost elegant. You live in Auckland. You want to get into the property market. The Auckland median house price currently sits at $950,000 [1], a figure that has made entry feel like a cruel joke for first-time buyers for years. But Christchurch? Christchurch you can manage. The average Christchurch property value is $804,850 as of August 2026 [2] — a meaningful gap. So you buy there, tenant it out to cover the mortgage, and rent yourself in Auckland. Rentvesting, they call it, and the strategy has a growing number of advocates.

The trouble is, a surprising number of people who adopt it are making a subtler mistake than they realise. They think they are hedging their exposure to the property market. They are not. They are placing two separate bets, and one of them is quietly working against them.

Source: Opes Partners

Source: Opes Partners

The wrong side of the TAB

With the Bledisloe Cup kicking off at Eden Park this weekend, the TAB odds tell an interesting story: All Blacks at $1.22, the Wallabies at $4.00 [3]. The ABs are overwhelming favourites and almost unbackable; you'd need to stake nearly five dollars just to make one. So you eye the Wallabies instead. Both tier one nations. Same corner of the world, same game, broadly similar talent. The Wallabies have been improving. At $4.00, they start to look tempting. The potential payoff is larger, the narrative is compelling, and it feels like genuine value, a smart contrarian bet on a credible alternative.

But rugby doesn't do partial results. One team wins, one team loses. There is no credit for geographic proximity, no points for picking the right hemisphere. If the All Blacks win and you backed the Wallabies, you have not hedged anything. You have simply lost.

Property works the same way. As an Auckland renter, rising prices hurt you directly: every time the market runs, the gap between what you can afford and what you need widens. Your Christchurch investment is not tracking that exposure. It runs on its own fundamentals: a different local economy, different employer base, different migration pressures, and the long-unfolding story of the post-earthquake rebuild.

Source: Opes Partners

The correlation problem

In investment terms, a hedge only works if the two positions are genuinely correlated. Auckland and Christchurch property are not that. Median Auckland values are down 26.9% from their peak, while Christchurch is down 1.32% and has been edging upward [1,2]. The two markets are moving on different timetables, driven by different forces. The correlation between them is low enough that owning one does not reliably protect you against the other; both can work against you simultaneously.

Over the past two decades, Auckland has experienced extraordinary price appreciation driven by supply constraints, population growth, and land scarcity that simply do not apply in Christchurch. The Canterbury rebuild added significant housing stock to the city. The dynamics are different. The risk profile is different. Buying one as a proxy for the other is, at best, a partial solution and, at worst, a false sense of security.

The real cost of remote landlording

Being a landlord costs more than being an owner-occupier. Significantly more. And doing it from another city costs more still. Property management fees typically run at eight to ten percent of rental income before letting fees, which can add another week or two of rent each time a tenant turns over [4]. A leaking tap in your own home costs you an hour. The same tap in a Christchurch rental managed from Auckland costs a callout fee, a plumber's rate, and a property manager's coordination time.

Add landlord insurance, rates, body corporate levies if applicable, and the compliance obligations under the Healthy Homes Standards [5]. Meeting insulation, heating, and ventilation requirements in older rental stock can run to several thousand dollars. These are not optional, and they are not cheap.

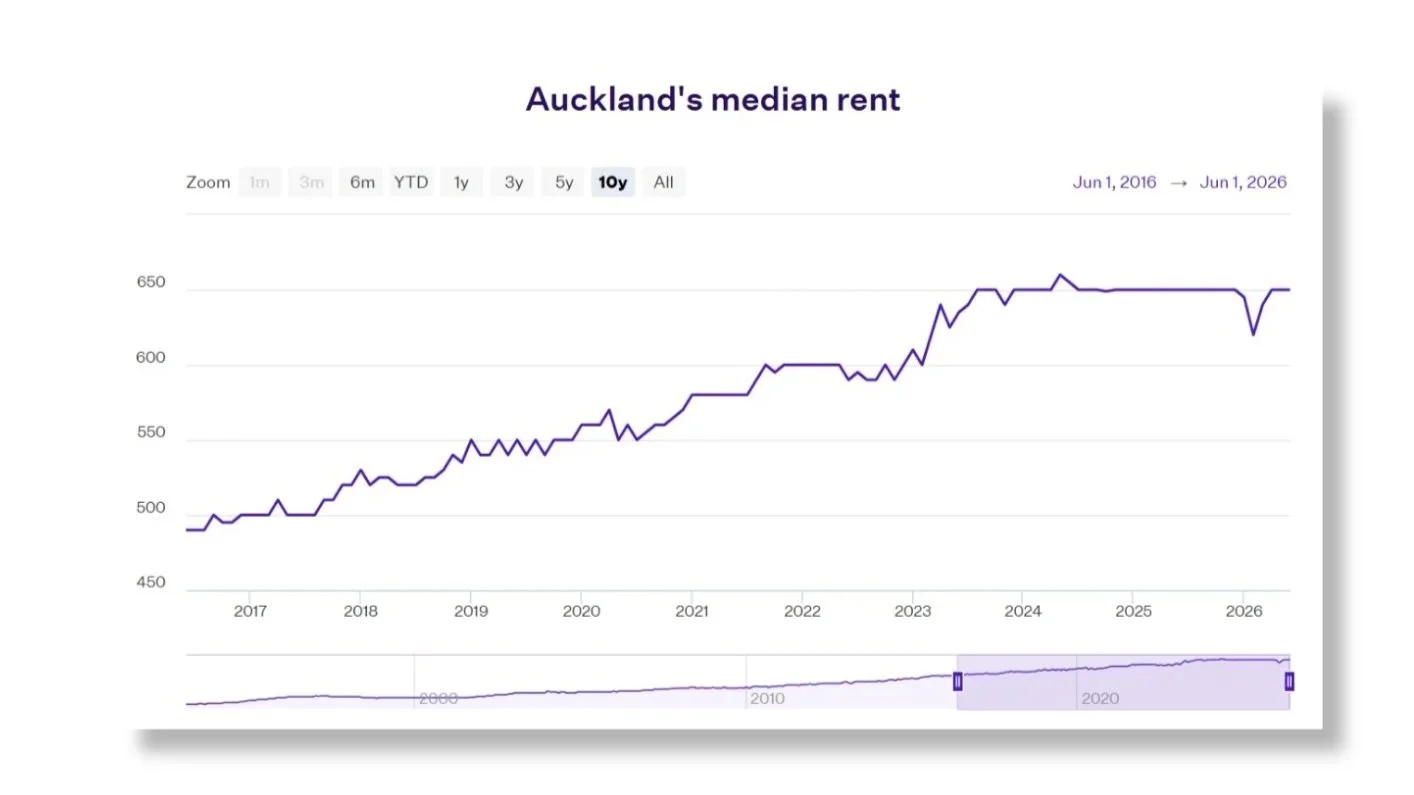
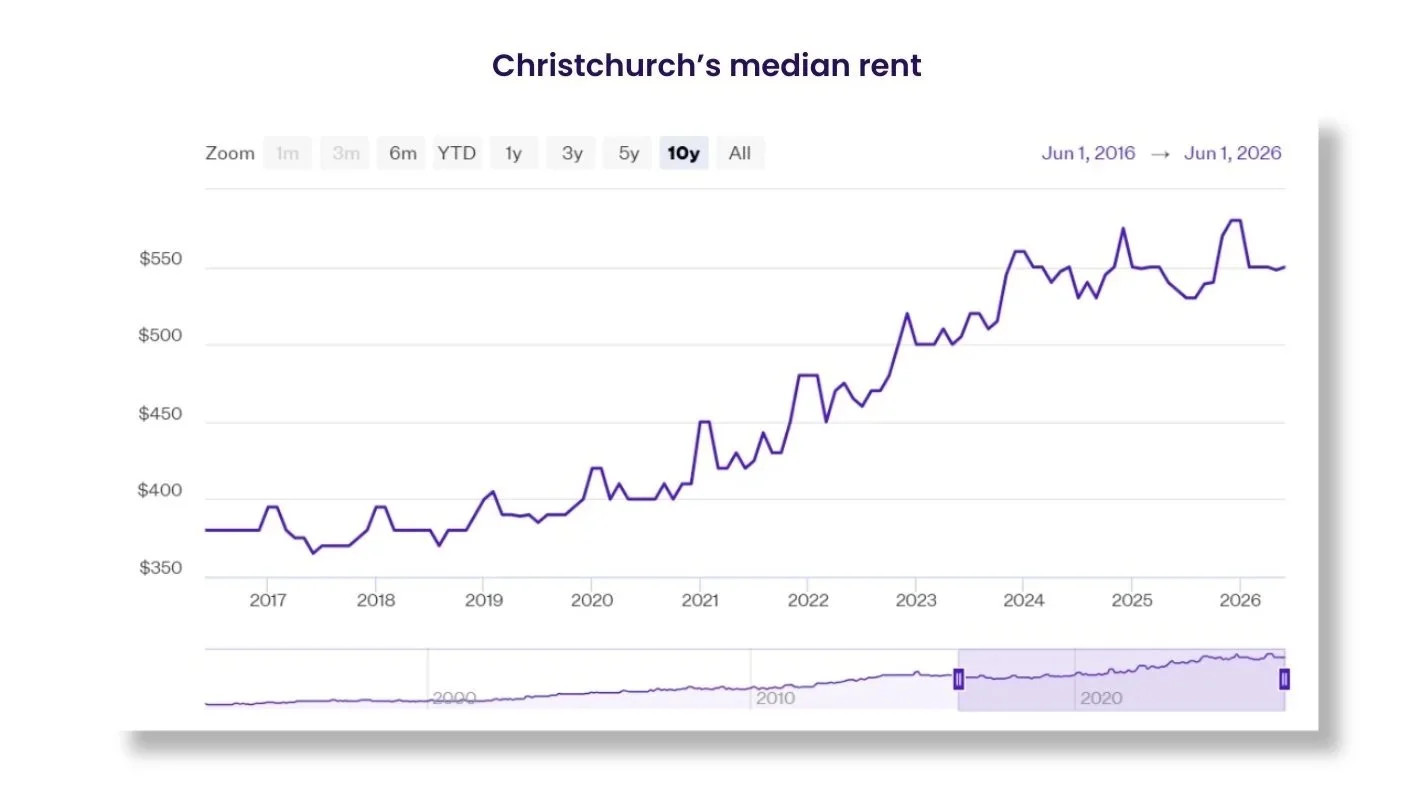
Then there is the tax asymmetry that catches many people off guard. Net rental income is taxable at your marginal rate [6]. The rent you pay in Auckland is not deductible in any form; it comes straight out of after-tax dollars. The average weekly rent is $650 in Auckland and $550 in Christchurch [1,2]. The real comparison is not $550 received versus $650 paid. It is $550 received, less expenses and tax, versus $650 paid from net income with no relief whatsoever. That gap is wider than most spreadsheets suggest.

Vacancy is the silent killer. Every week the property sits empty, the mortgage runs without the rent. From Auckland you cannot simply drive past, tidy the garden, and get it listed. You wait. Your property manager moves at their pace, not yours.

The risk nobody puts in the plan

The most underappreciated risk is personal circumstance, and the risk nobody likes to plan for. Life changes. Relationships shift. Jobs move. Children arrive and schooling zones start to matter. When the day comes that you need to own the roof over your head, you will be selling a Christchurch asset into whatever market conditions exist at that moment, then trying to buy into an Auckland market that has been doing its own thing for years. The timing is entirely outside your control.

None of this means rentvesting is a bad idea. For some people, in some situations, it remains a perfectly sensible first step onto the ladder; better to build equity somewhere than nowhere. But it should be entered as what it actually is: an investment position with real, specific, and knowable risks. Not a clever workaround that sidesteps the hard questions.

The property market does not reward good intentions. It rewards good planning. And good planning starts with being honest about which team you are actually backing, and whether the odds genuinely make sense for the result you need.


Nick Stewart

(Ngāi Tahu, Ngāti Huirapa, Ngāti Māmoe,
Ngāti Waitaha)

Financial Adviser and CEO at Stewart Group

  • Stewart Group is a Hawke's Bay and Wellington based CEFEX & BCorp certified financial planning and advisory firm providing personal fiduciary services, Wealth Management, Risk Insurance & KiwiSaver scheme solutions.

  • The information provided, or any opinions expressed in this article, are of a general nature only and should not be construed or relied on as a recommendation to invest in a financial product or class of financial products. You should seek financial advice specific to your circumstances from a Financial Adviser before making any financial decisions. A disclosure statement can be obtained free of charge by calling 0800 878 961 or visit our website, www.stewartgroup.co.nz


References 

  1. Opes Partners, Auckland Property Market (2026): Average House Prices, 16 September 2026. https://www.opespartners.co.nz/property-markets/auckland

  2. Opes Partners, Christchurch Property Market (2026): Average House Prices, 22 September 2026. https://www.opespartners.co.nz/property-markets/canterbury/christchurch

  3. TAB New Zealand, Bledisloe Cup match odds.

  4. RentManager, How Much Do Property Managers Charge in NZ? (2026 Fee Breakdown), updated 14 August 2026. https://rentmanager.nz/blog/how-much-do-property-managers-charge-nz

  5. Tenancy Services, Healthy homes compliance. https://www.tenancy.govt.nz/healthy-homes/healthy-homes-compliance/

  6. Inland Revenue, Pay tax on your rental income, updated 1 April 2026. https://www.ird.govt.nz/property/renting-out-residential-property/residential-rental-income-and-paying-tax-on-it/pay-tax-on-your-rental-income

The Prison of the Middle Class

Article #477

A lazy shorthand dominates every cost-of-living conversation here: the haves and the have-nots. Two boxes, a line down the middle, a moral position attached to each. It survives because it is easy, not because it is true. 

Mark Carney put it plainly: if you are not at the table, you are on the menu [1]. The households carrying the weight of this are the least represented in the argument about it. 

Some have-nots have far more than others. Some haves are one interest rate reset from the wrong side of the ledger. The surface tells you little. The four-wheel drive is a liability with a registration plate. The holiday home is a security instrument with a view. Wealth, for many New Zealanders, is illusory: a number on a valuation notice that funds nothing but demands payment every month. 

The people trapped by that illusion are not the poorest New Zealanders. They are the battlers; around 1,200,000 households on Pita Alexander's count, roughly 58 percent of the country's 2,072,000 households [2]. 

The arithmetic of the squeeze 

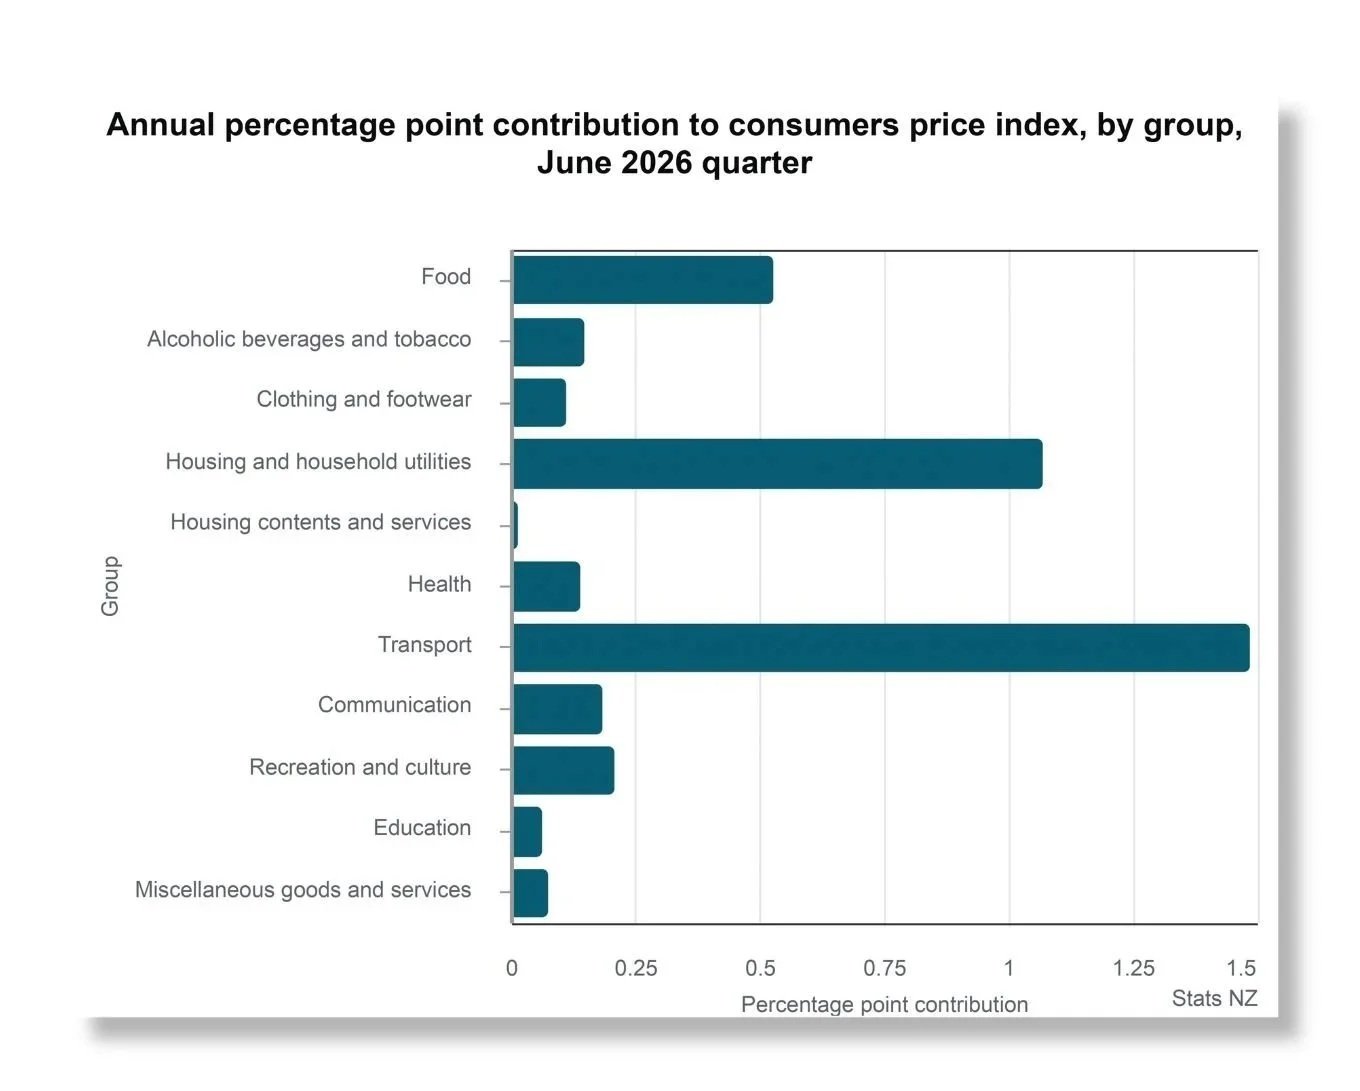
Take a Hastings household on two incomes, two cars and a mortgage. Run the last twelve months across it. Petrol up 27.5 percent. Tertiary education up 22.6 percent. Electricity up 12.0 percent. A GP visit up 10.3 percent [3]. 

Then add the line no minister has to sign. The average proposed council rates rise for 2026/27 is 6.9 percent, against annual inflation of 4.1 percent [4]. Petrol was the largest single contributor to that 4.1 percent [3]. Rates were the quiet one, up 34.4 percent across the last three-year council term while general inflation ran at 13.7 percent [5]. 

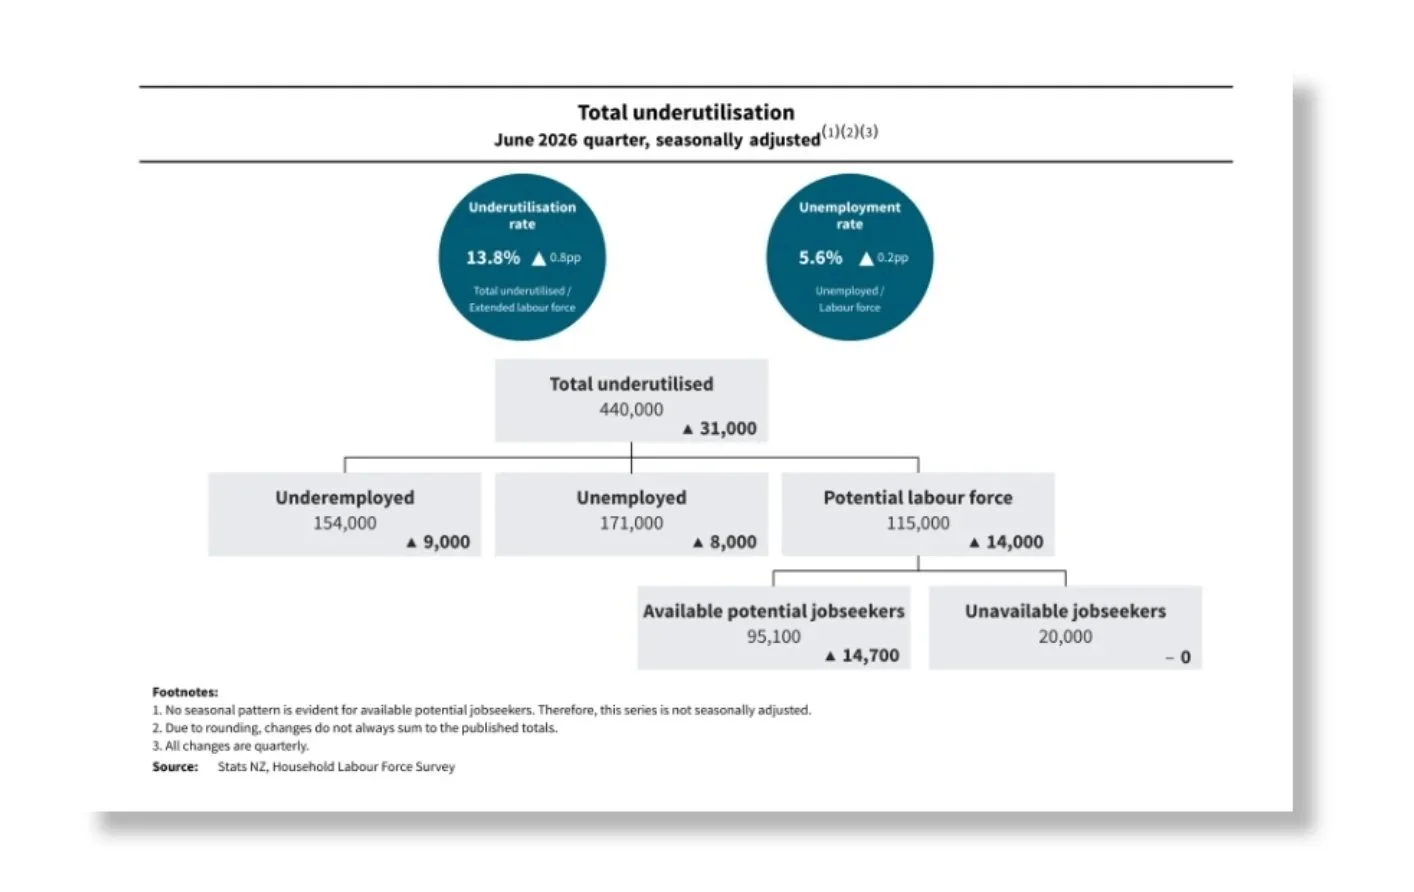
At $1.25 per kilometre on a full running-cost rate, those two cars eat $19,500 a year [2]. Before the mortgage. Unemployment has reached 5.6 percent, the highest since 2015, with underutilisation at 13.8 percent [6]. Both adults still work, both cars move, and the 3 percent pay rise was gone before it arrived. On those two Hastings incomes the surplus this year is a few hundred dollars, if the hot water cylinder holds. That is not a lifestyle. It is the hire that does not happen. 

None of this is attitude. When Rotorua business owners told the Prime Minister they could not pass their costs on, he called the framing negative and said the country had a parent-child mentality. He apologised days later. The apology was the right instinct; the original answer treated arithmetic as mindset [7]. 

The evidence is in the withdrawals 

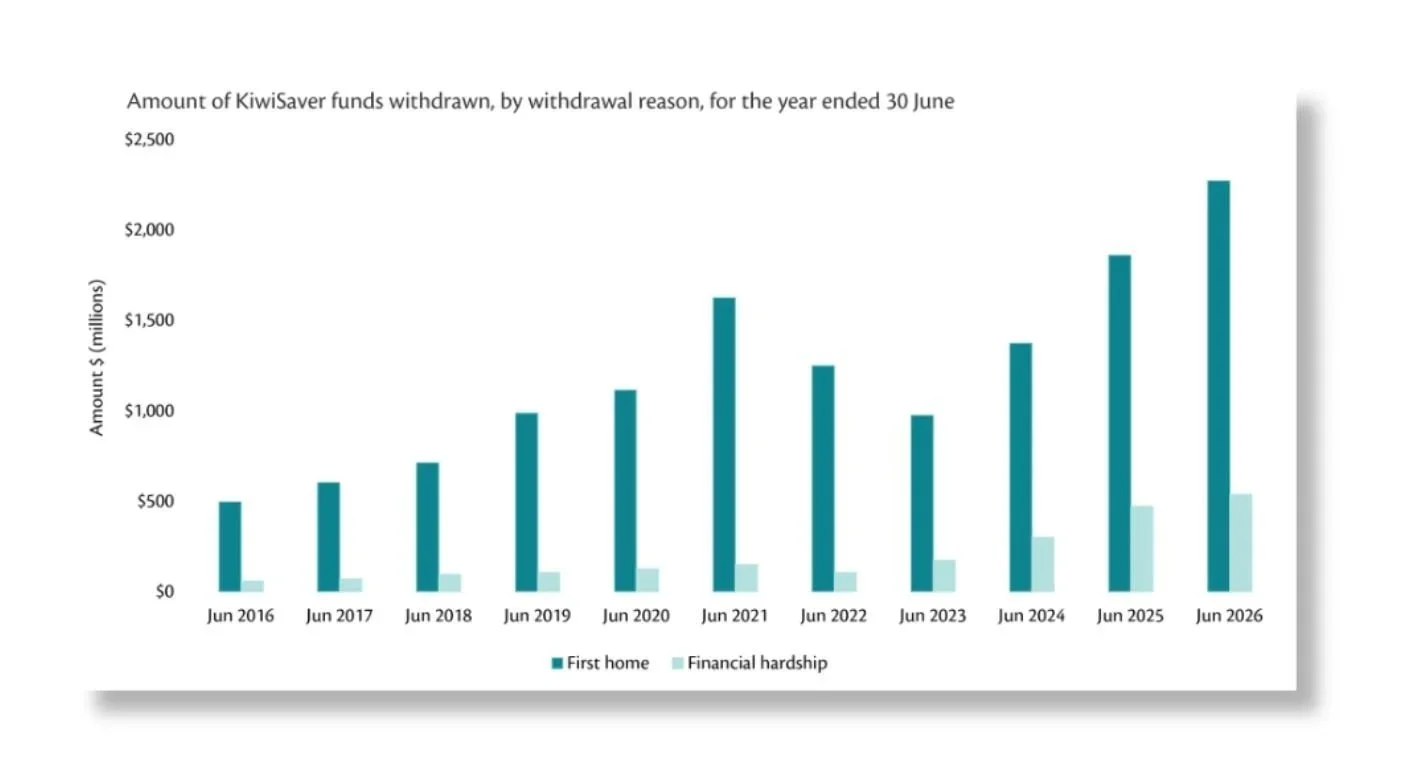
Ignore the rhetoric; look at what people do with their savings. KiwiSaver hardship applications doubled in two years, passing 58,000 in 2025, and are running higher again in 2026. Inland Revenue paid out $471.2 million on hardship grounds in the June 2025 year [8] [9]. These are not people gaming a system. They are breaking open the last jar in the house. 

Source: Inland Revenue

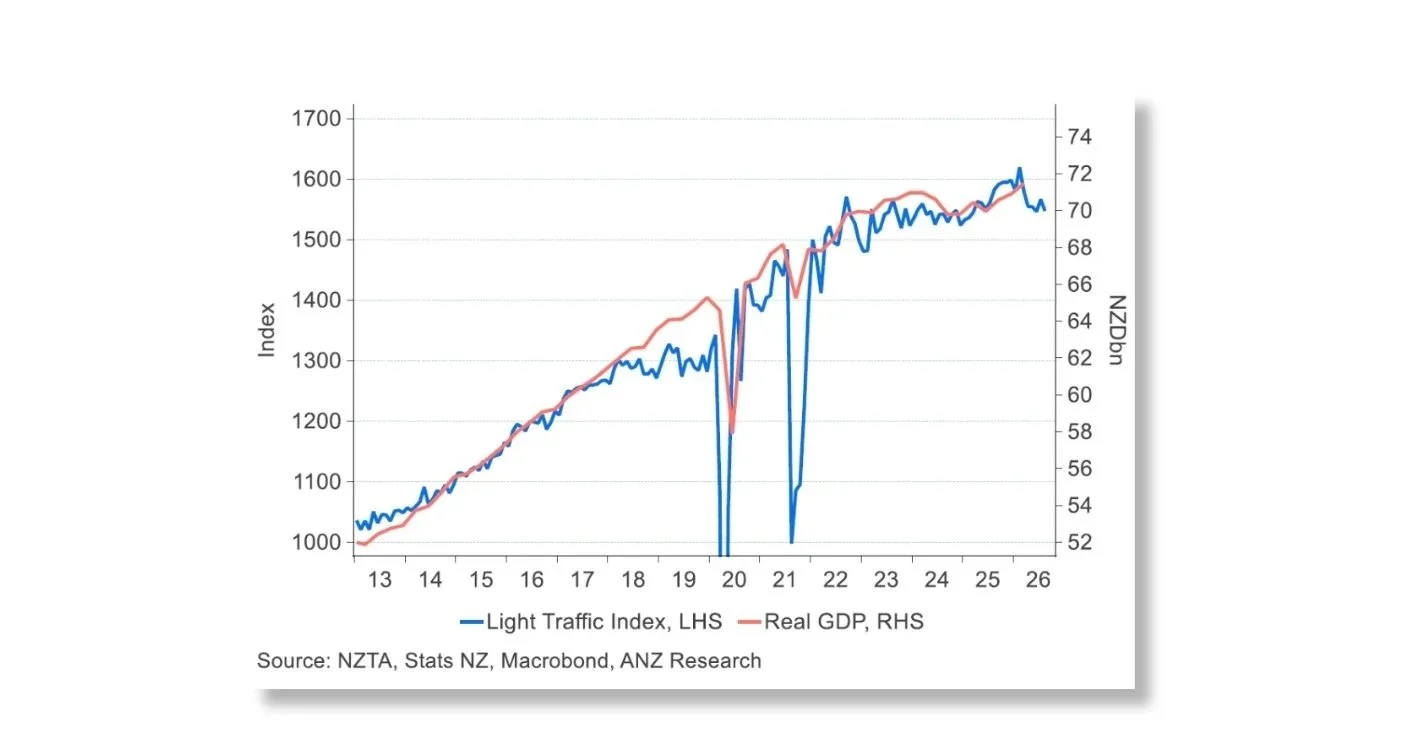
ANZ's Truckometer says the same in another language: light traffic sits below a year ago, because fewer of us drive to work [10]. Sixty thousand applications in a year is structural failure, one family at a time. 

Source: NZTA, Stats NZ, Macrobond and ANZ Research

What actually lifts a country 

Our best resource sits under our feet. We have an extraordinary climate and exceptional soils, and through every hard period, it is what we grow and sell abroad that sees us right. On the East Coast that comes with a payroll. Take the orchard contractor running four utes through the apple season. His fuel is up more than a quarter, his rates too. What his growers can pay him has not moved. In a normal February he would take on an extra picker. This year he runs the crew short and works the weekends himself. That wage is never offered, never spent in a Hastings shop, never taxed. Regulation that adds a form, a fee or a delay to that operation is not neutral. It comes out of the same ledger. 

A healthy, aspirational middle class is not a nice-to-have in a growth economy. It is the engine. Aspiration requires surplus. Strip the surplus away and you do not get a poorer middle class, you get a stationary one: households that stop taking risks, stop hiring, and optimise for survival. That is a prison, and it has no obvious bars. 

Run the Hastings household forward six years. KiwiSaver contributions drop to the minimum, to keep the mortgage current, and never go back up. Buying a rental remains a conversation. The contractor never hires the extra picker, and the business his daughter was meant to take over is still his. No single year looks like failure, but together they make a household that stopped moving. 

History is blunt on this point. Rome ran on its smallholding farmers. They owned a few acres, paid their way, and filled the legions. Then the wars grew longer. Men were away for years, debts mounted, and the great estates bought the land behind them. Rome kept its wealth. It lost its middle. The century that followed was not a happy one. 

No nation announces the moment its middle class stops moving upward. It finds, a generation later, that something load bearing has gone. 

Look abroad and the pattern holds. Two decades ago, Poland’s income per head was a third of Britain's. It is now about 87 percent of it on a purchasing power basis and projected to draw level around 2030 [11]. Britain did not choose that; it simply let the squeeze run. We are not Britain yet, but the mechanism that took it there is the one running here now. 

Where this is heading 

Very little suggests relief. Both major parties are working at the fringes. 

The Reserve Bank lifted the official cash rate to 2.75 percent on 2 September, a second consecutive rise, and has said it may need to go further this year [12]. For a household already one reset from the wrong side of the ledger, that is not a forecast. It is a repayment. A rates cap begins its transition on 1 January 2027, after the election [13]. Pita Alexander puts the Crown $10 to $12 billion short of fiscal income and reckons that group needs about $4,000 a year more, $2,800 after tax, to restore a buffer [2]. Neither is on offer. 

The battlers are not asking to be rescued. They are asking for the arithmetic to work again. 

The arithmetic from Wellington is not yours to change. The arithmetic at your kitchen table is. Know those numbers as precisely as you would demand of a council to know its own, and get a clear-eyed view of a position a valuation notice will flatter, and a mortgage statement will not. Take good counsel on it. 


Nick Stewart

(Ngāi Tahu, Ngāti Huirapa, Ngāti Māmoe,
Ngāti Waitaha)

Financial Adviser and CEO at Stewart Group

  • Stewart Group is a Hawke's Bay and Wellington based CEFEX & BCorp certified financial planning and advisory firm providing personal fiduciary services, Wealth Management, Risk Insurance & KiwiSaver scheme solutions.

  • The information provided, or any opinions expressed in this article, are of a general nature only and should not be construed or relied on as a recommendation to invest in a financial product or class of financial products. You should seek financial advice specific to your circumstances from a Financial Adviser before making any financial decisions. A disclosure statement can be obtained free of charge by calling 0800 878 961 or visit our website, www.stewartgroup.co.nz


References 

[1] Prime Minister of Canada. (2026, January 20). "Principled and pragmatic: Canada's path" Prime Minister Carney addresses the World Economic Forum Annual Meeting. https://www.pm.gc.ca/en/news/speeches/2026/01/20/principled-and-pragmatic-canadas-path-prime-minister-carney-addresses  

[2] Alexander, P. "The Cost of Living is a Core Problem in New Zealand". Pita's Perspective, 6 August 2026. 

[3] Stats NZ. Consumers price index: June 2026 quarter. 21 July 2026. https://www.stats.govt.nz/information-releases/consumers-price-index-june-2026-quarter/.  

[4] New Zealand Taxpayers' Union. Rates Dashboard 2026. 9 July 2026. https://www.taxpayers.org.nz/rates2026. 

[5] New Zealand Taxpayers' Union. “2025 Rates Dashboard Exposes Out of Control Rates Burden”. 14 July 2025. https://www.taxpayers.org.nz/2025_rates_dashboard_exposes_rates_burden. 

[6] Stats NZ. Labour Market Statistics: June 2026 quarter. 5 August 2026. 

[7] Moir, Jo. “Prime Minister Christopher Luxon's ‘parent-child mentality’ description of NZ businesses ‘valid’ in some cases: Seymour”. RNZ, 2 August 2026. https://www.rnz.co.nz/news/politics/858368/prime-minister-christopher-luxon-s-parent-child-mentality-description-of-nz-businesses-valid-in-some-cases-seymour. RNZ. “Watch: PM Christopher Luxon apologises for ‘parent-child mentality’ comments”. 3 August 2026. https://www.rnz.co.nz/news/politics/874803/watch-pm-christopher-luxon-apologises-for-parent-child-mentality-comments  

[8] Inland Revenue. Statistics on KiwiSaver funds withdrawn, by amount. Updated 24 August 2026. https://www.ird.govt.nz/about-us/tax-statistics/kiwisaver/withdrawals/amount. 

[9] Edmunds, Susan. “Exhaust other options first, withdrawing KiwiSavers told”. RNZ, 25 June 2026. https://www.rnz.co.nz/news/business/620439/exhaust-other-options-first-withdrawing-kiwisavers-told. 

[10] ANZ Research. ANZ Truckometer: August 2026 data. 10 September 2026. https://www.anz.co.nz/content/dam/anzconz/documents/economics-and-market-research/2026/ANZ-Truckometer-20260910.pdf. 

[11] International Monetary Fund. World Economic Outlook Database, April 2026: GDP per capita, current prices, purchasing power parity. https://www.imf.org/external/datamapper/PPPPC@WEO. 

[12] Reserve Bank of New Zealand. Monetary Policy Statement September 2026. 2 September 2026. https://www.rbnz.govt.nz/monetary-policy/monetary-policy-statement/monetary-policy-statement-filtered-listing-page/2026/sep-0209/monetary-policy-statement-september-2026. 

[13] New Zealand Government. “Government to cap rates”. 25 August 2026. https://www.beehive.govt.nz/release/government-cap-rates. New Zealand Government. “Rates Capping Bill passes first reading”. 1 September 2026. https://www.beehive.govt.nz/release/rates-capping-bill-passes-first-reading. 

What a Chilean coin knows about breaking up the supermarkets

Article #476

A friend and colleague in Chile was knocked off his bike by a delivery motorcycle, rupturing a hamstring. Four months off the bike. I wanted to post him honey from our hives, but quarantine rules will not let honey near a border, so he got possum and merino socks instead. Back came an intriguing coin.

One coin, two sides. Seven economists, the “Chicago Boys”, are featured, with one face honouring them as the architects of Chilean economic development. On the reverse sits Chile’s coat of arms and its national motto: Por la razón o la fuerza. By reason or by force. The coin tells the story of a country that tried both.

Nick with Rodrigo and the Chilean coin he kindly gifted him

From 1971 the Allende government nationalised copper, with Congress voting for it. It took the banks, and by late that year the state controlled seventeen of them holding around 90% of the country’s credit. Factories were requisitioned into public ownership. Wages rose and prices were held down. [1]

Then the shelves emptied. A black market grew. By January 1973 the government was rationing dozens of essentials, bread among them, and neighbourhood supply and price committees decided who got what. By December 1973, consumer prices were 508% higher than a year earlier. [2]

Now look at our ballot.

The Greens would force Foodstuffs and Woolworths to sell 120 stores and two distribution centres into public ownership as KiwiMart, at a cost of $2.8 billion. New Zealand First would buy the BNZ back from NAB and merge it with Kiwibank, at $7.5 billion upwards, with compulsory acquisition held in reserve. Labour would not take ownership but would set the price by banning excessive pricing on essentials. National, which normally resists this sort of thing, would split Pak’nSave from New World and Four Square if the Commerce Commission agreed that the separation would leave shoppers better off. [3]

Four parties, four instruments, one instinct. Peters calls it “taking back our country” rather than nationalisation, recalling the warning attributed to Emerson: “The louder he talked of his honour, the faster we counted our spoons.”

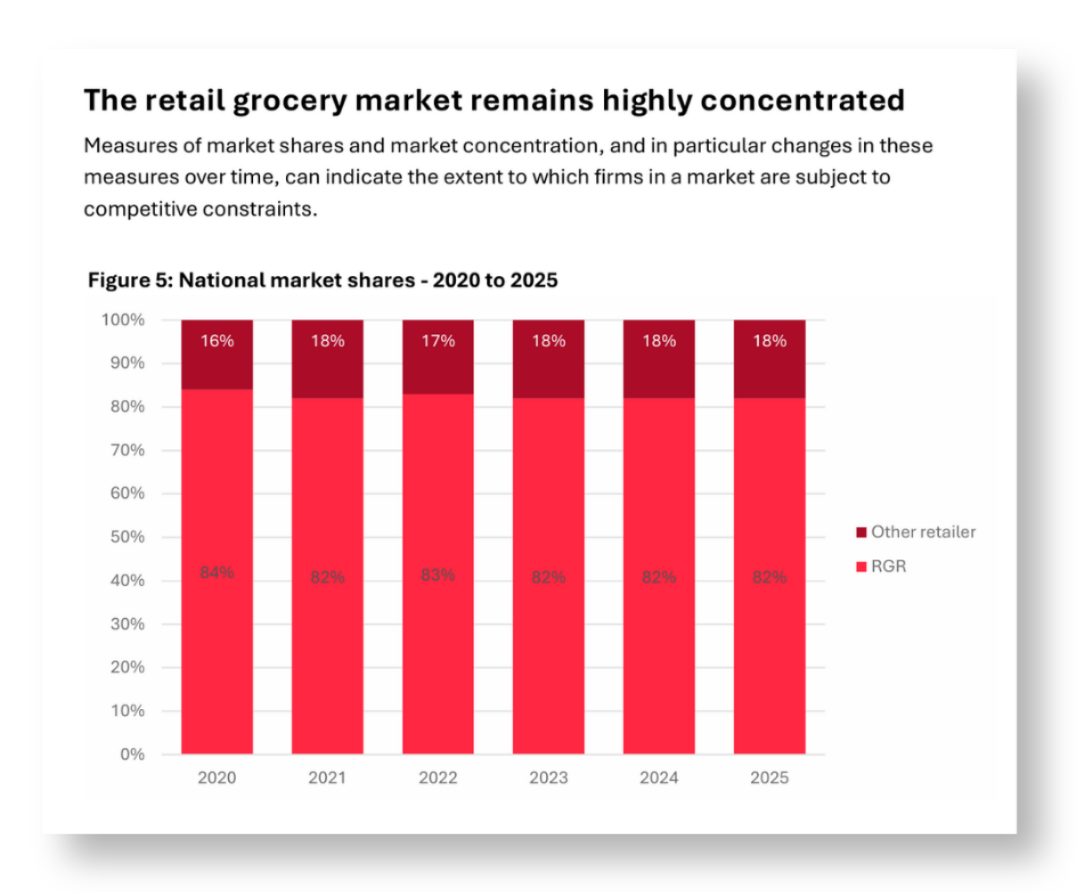
The grievance is real. The 2022 market study found the duopoly controlled about 90% of main grocery shopping, with excess profits the Commission then put at more than a million dollars a day. Four Australian-owned banks hold about 84% of lending. Nobody doing the weekly shop needs convincing that something is wrong. [4]

Source: Annual Grocery Report 2025/2026 - Commission analysis of sales revenue provided by industry participants and Statistics New Zealand data. RGR = Regulated Grocery Retailer

National’s proposal is the only one that changes market structure rather than ownership. It leaves every store in private hands and defers to the Commerce Commission. Willis is right that incremental reform has not delivered. ACT is against it. Foodstuffs points out that more than 500 owner-operated stores sit inside the two co-operatives. [5]

But all four reach for the till when the harder question is why nobody can build a shop.

Here is what that question looks like on the ground, twenty minutes from our Hastings office. In 2012, Foodstuffs North Island bought a site across the road from Pak’nSave Tamatea in Napier. It sold the site in 2015 with a covenant barring its use as a supermarket, one of a set running for up to 99 years. Woolworths had two stores in central Napier and none in the south of the city. The High Court found the covenant had been lodged to stop Woolworths, or anyone else, from developing a supermarket there. Justice Radich called the conduct deliberate and serious and, in August 2024, fined Foodstuffs $3.25 million, the largest penalty yet under section 28 of the Commerce Act. [6]

That is a Napier site that could have carried a third banner but did not. No act of nationalisation would have put one there. A rule did the damage, and a rule undid it. Grocery land covenants were banned in 2022 and are now unenforceable, but the Commission pursued the case anyway. [8]

Milton Friedman drew a distinction worth keeping in mind here. Being pro-free enterprise is not the same as being pro-business. Business corporations in general, he wrote, are not defenders of free enterprise but one of the chief sources of danger to it. Almost every owner wants open competition for everybody else and a little protection for himself. [7]

A covenant on a title is a moat dug by a company. A consent that takes years is a moat dug by a council. Both keep the third banner out, and the shopper pays for both. Defending property rights is not the same as defending the incumbent.

Yet four years on, there is still no third full-line chain in this country. Costco entered as a warehouse club, with its second site set to go up in Drury’s fast-tracked town centre. The Government now has a bill before the House creating a consenting express lane for new supermarkets. That is the admission. The binding constraint is not who holds the title. It is how long it takes to get a shop out of the ground. [8]

What changed Chile was not who held the shares but the conditions for competition: stable money, open entry, enforceable contracts and taxes that businesses could live with. From 1987 to 2015, the proportion of Chileans living below the national poverty line fell sharply, while income per person rose substantially. [9]

Scotsman Adam Smith made the same case centuries earlier: little else was needed to carry a state from the lowest barbarism to the highest degree of opulence but peace, easy taxes and a tolerable administration of justice. [10]

Source: Commerce Commission New Zealand

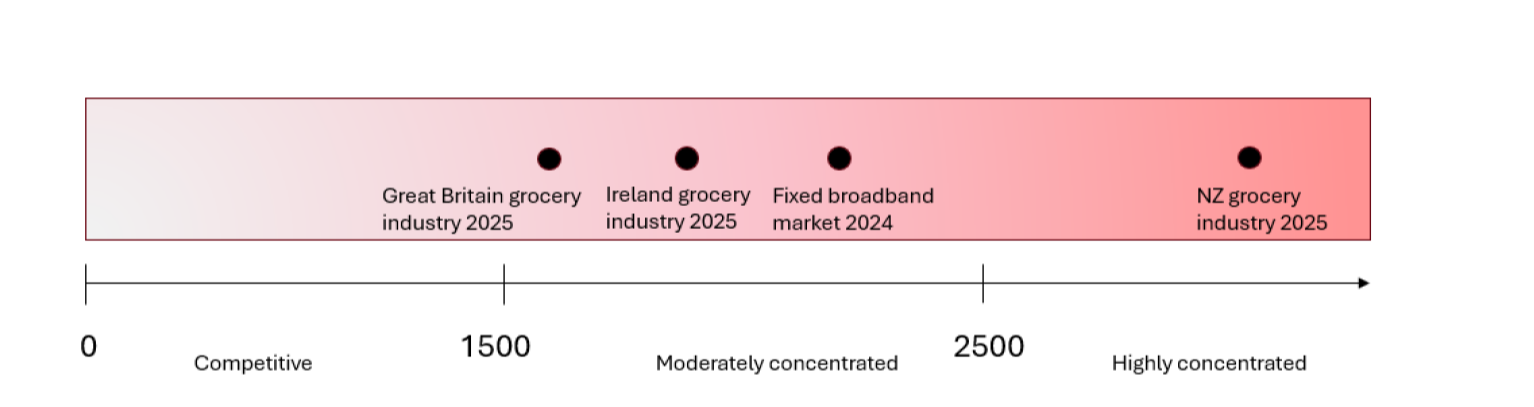
Herfindahl-Hirschman Index (HHI) takes the market shares of each firm in a market.

New Zealand’s grocery industry HHI for 2025 was 3,585 which indicates limited competitive pressure. Concentration in Auckland also remains high, with the HHI increasing to 2,635 in 2025, from 2,561 in 2024.

Click to view Annual Grocery Report

Smith’s other observation was our propensity to truck, barter and exchange. Nobody directed the socks or the coin, no price was named, and both of us came out ahead. The only authority involved was the biosecurity rule that stopped the honey, exactly the sort of plain, predictable rule Smith meant.

The honest part is what the coin leaves off. Chile’s reforms were imposed by a dictatorship, which stripped them of legitimacy. Growth continued after democracy returned in 1990: force set the policy, but reason made it stick. [9]

There is a cost in all of this that appears in none of the parties’ costings, and it lands on people who did not vote for any of it.

Every valuation rests on what a business will earn and the rate at which those earnings are discounted. Political risk goes into that rate. Lift it and the value falls, with no change in the till.

Neither Foodstuffs nor Woolworths New Zealand is listed here, and BNZ belongs to NAB, so no New Zealand portfolio moved directly on those announcements. The precedent is what moves. If a government can force an owner to sell a profitable business at a price set by the Crown, or legislate its structure apart, every regulated business in this country carries a little more risk than it did a month ago. Contact, Meridian, Genesis and Mercury are on that list, and New Zealand First has named them for a split of its own. So are the ports, airports and lines companies.

KiwiSaver held $138.8 billion at March 2026. Those companies sit inside it. The people who own them are not speculators. They are teachers, shearers and people in their sixties who have been contributing since 2007. [11]

Property rights are not an ideological flourish. They underpin every valuation of the shares held in your portfolio and KiwiSaver.

Fix the rules and competition follows. Buy the shops and the government owns the queue.

The Chileans put both options on their coat of arms and have tried each one: by reason or by force.

The vote will decide which of those we reach for. How you respond is still your choice and worth good counsel.


Nick Stewart

(Ngāi Tahu, Ngāti Huirapa, Ngāti Māmoe,
Ngāti Waitaha)

Financial Adviser and CEO at Stewart Group

  • Stewart Group is a Hawke's Bay and Wellington based CEFEX & BCorp certified financial planning and advisory firm providing personal fiduciary services, Wealth Management, Risk Insurance & KiwiSaver scheme solutions.

  • The information provided, or any opinions expressed in this article, are of a general nature only and should not be construed or relied on as a recommendation to invest in a financial product or class of financial products. You should seek financial advice specific to your circumstances from a Financial Adviser before making any financial decisions. A disclosure statement can be obtained free of charge by calling 0800 878 961 or visit our website, www.stewartgroup.co.nz


References

1. Espinosa, R. (2021). Salvador Allende’s development policy: lessons after 50 years. Economic Affairs; De Vylder, S. (1974). Allende’s Chile. Cambridge University Press.

2. Edwards, S. (2023). The Debauchery of Currency and Inflation: Chile, 1970–1973. NBER Working Paper 31890; Datosmacro.com. (1973). IPC de Chile 1973, reporting December 1973 CPI inflation of 508.0% year-on-year.

3. RNZ and 1News, 16 September 2026, National to pursue Pak’nSave and New World break up; NZ Herald, 3 September 2026, Greens promise to nationalise 120 supermarkets; RNZ and interest.co.nz, 17 May 2026, NZ First proposal to buy back BNZ and merge with Kiwibank; NBR, 16 September 2026, Labour price gouging policy.

4. Commerce Commission (2022). Market study into the retail grocery sector: Final Report, 8 March 2022; Reserve Bank of New Zealand banking sector statistics, 2026.

5. RNZ and 1News, 16 September 2026, National to pursue Pak’nSave and New World break up. The independent analysis cited by Nicola Willis modelled grocery prices 3.5% lower after one year and 5% lower after six, with $12.6 billion of consumer benefit over twenty years. Foodstuffs and ACT responses reported the same day.

6. Commerce Commission v Foodstuffs North Island Ltd, High Court, Wellington, August 2024; Commerce Commission media release, 8 August 2024; Simpson Grierson, Competition and Consumer Law Update, August 2024.

7. Friedman, M. (1999). The Business Community’s Suicidal Impulse. Cato Policy Report, Vol. XXI No. 2, for the quoted sentence; the wider argument runs through Friedman, M. and Friedman, R. (1980). Free to Choose. Harcourt Brace Jovanovich.

8. Commerce (Grocery Sector Covenants) Amendment Act 2022; Commerce Commission v Foodstuffs North Island, $3.25 million penalty, 2024; RNZ and Beehive, 12 November 2025, second Costco store at Drury and the supermarket consenting express lane bill.

9. World Bank. Poverty headcount ratio at national poverty lines (% of population) – Chile, 1987–2015; World Bank. GDP per capita (constant 2015 US$) – Chile, 1987–2015; Edwards, S. (2023). The Chile Project: The Story of the Chicago Boys and the Downfall of Neoliberalism. Princeton University Press.

10. Stewart, D. (1793). Account of the Life and Writings of Adam Smith LL.D., quoting a paper by Smith of 1755; Smith, A. (1776). An Inquiry into the Nature and Causes of the Wealth of Nations, Book I, Chapter 2.

11. Plan For Life research, KiwiSaver funds under management at March 2026.

Into the Tenth Year: the Froth, the Fear and What I Got Wrong

Article #475

This week Canny View rolls into its tenth year under that masthead. I had been writing and being interviewed for a good while before the name went up in print, but the masthead has its own anniversary, and this is it. Ten years is also the period our industry uses to judge anything worth judging, so rather than mark the occasion with sentiment, let us mark it by looking at the decade just gone.

Rewind to 2016. John Key was Prime Minister and would resign within three months. The Official Cash Rate had just been cut to 2 percent, a record low at the time. Bitcoin was about US$600. KiwiSaver held roughly $35 billion. New Zealand, after a remarkable run, had been one of the best performing developed sharemarkets in the world over the preceding decade.

AI was a research topic, not an investment theme, and rockets were the business of governments. Had you suggested the most talked about launch company of the coming decade would be firing satellites into orbit from a paddock at Mahia, you would have been humoured and offered another drink.

The settled view then was that returns would be thin for years. It was wrong, as it usually is. The scoreboard since then is a useful reminder of how poorly certainty ages.

The scoreboard

Including dividends, a dollar invested in United States shares in September 2016 is worth roughly four times what it was. Morningstar puts the return of US equity funds at 13.3 percent a year over the decade to December 2025, the most profitable ten years in the category's history.

Source: Trading View

The NZX 50 almost doubled, reaching 13,757 at last close*. Respectable. But the market that led the developed world to 2016 spent the ten years after it well behind.

Then there is Rocket Lab. Launching from Mahia, listed on the Nasdaq, and worth around NZ$80 billion. One company, built here and launching from here, is worth two fifths of every company on our own sharemarket combined, while sitting outside it.

Leadership rotates without warning and never announces the handover. That is the whole argument for owning the world rather than the paddock you happen to live in.

Source: Stuff

What we lived through to get there

Four times your money looks serene on a chart, yet it was not serene to live through: the late 2018 slide, the 2020 crash that took a third off global markets in thirty-three days, the 2022 bear market when shares and bonds fell together, and this year’s crypto unwind and Middle East tension. Each one was a headline. Not one was a reason to dismantle a properly built portfolio.

Source: CRSP Market Deciles 1-10 Cap-Based Portfolio (total returns in USD). All US exchanges rebalanced quarterly.
Data provided by the Center for Research in Security Prices (CRSP), University of Chicago.

Edmund Burke wrote in 1790 that because half a dozen grasshoppers make the field ring with their importunate chink, while thousands of great cattle chew the cud in silence, we should not imagine that those who make the noise are the only inhabitants of the field.

Two hundred and thirty six years on, the grasshoppers have a podcast and a following. The cattle still say nothing.

The habit gap

Here is the finding that should stop every investor cold. Morningstar examined 23,000 American funds over the same ten years. The funds returned 9.9 percent a year; the average dollar invested in them earned 8.7 percent. That gap is not fees and not fund performance. It is timing: buying after the good news and selling after the bad. Across the decade, it cost investors about US$3.8 trillion.

The encouraging half is that the gap shrank wherever temptation was hardest to indulge. Investors in broadly diversified all-in-one funds captured almost all of their return; those in index funds gave up 0.1 of a percentage point. That is not evidence that advisers rescue people mid-panic. It is evidence that the gap was smallest where the structure had already removed the decision: broad diversification, rebalancing on a date rather than a feeling, and contributions that arrive whether or not you fancy investing.

Architecture, not heroics. Less doing, more owning.

Bitcoin, meme coins and the black dog

Bitcoin has been the decade's most spectacular chart, from about US$600 to a peak of US$126,209 in October 2025, and its clearest lesson in the gap between an asset's return and an investor's return. Crypto ETFs listed since January 2024 returned 8.5 percent a year to 30 June 2026, yet the average dollar in them lost 5.8 percent a year, a gap of more than fourteen points. Money arrived after Bitcoin had climbed and left after it had fallen. Beneath it sits the meme coin, priced on nothing but the hope that the next person is willing to pay more.

Chasing it has been like chasing a black dog in the night: money pouring after something you cannot quite see, arriving after the climb and leaving after the fall. Calling something digital gold does not make it gold.

Where I got it wrong, and where the design spared me

Very few of our macro calls have gone badly wrong across the decade, and that is not luck dressed as skill. Do not mistake us for a passive firm. We work very hard, but the work goes into engineering, not forecasting. The plan is engineered on evidence, tested and rebuilt, and everything flows from it.

Nor are the portfolios index trackers. They lean deliberately on the dimensions the research has borne out over decades: company size, relative price, and profitability, the work of Fama and French and what followed it. That is a design decision, made on evidence and held, rather than a view on next quarter. We are active in the design and the planning, not in the stock picking or the market timing. My job is to engineer, not to predict.

The errors that cost were process errors. Choosing who you build your business with is pivotal, and I have twice chosen badly: one supplier over-promised, one developer under-delivered. Neither cost much money, but both cost time, and time compounds into the money you never got around to making. The lesson is the old one: it is either up to standard or down to price.

Then two judgement calls, neither about markets.

I hoped our love affair with residential property would cool. It has not, despite the asset delivering one of its more sobering decades. The average New Zealand house is down 15 to 17 percent from its 2021 peak in dollar terms and 28 to 31 percent adjusted for inflation, twice as deep as the post-global financial crisis trough of 16 percent. Here is the part that stopped me: in real terms, Cotality has the average house worth about what it was in mid-2016. A full decade, and in purchasing power the family home has gone precisely nowhere. And still we treat one leveraged, undiversified, illiquid asset in one small corner of the world as a retirement plan.

Source: CoreLogic

The House Price Index (HPI) measures the movement in house prices throughout New Zealand, providing an indicator of capital growth. The data is compiled and published by CoreLogic. Data from 1990 is available in the key graph data file.

The second was not a market call at all. I assumed my father would age gracefully. He died at 76. Every retirement plan I build carries a longevity assumption, and I had quietly applied a generous one to my own family without examining it. I see the same blind spot in households: people can often recite every detail of the money: salaries, perks, KiwiSaver contributions, cover held through work, yet cannot say when they last had a check-up, or what their cholesterol, PSA, or calcium heart score might be. We measure what is easy to measure and quietly assume the rest will hold, but the plan assumes years you may not be given, so spend some of them while you can.

Beyond those, I have been fortunate to take counsel from some beautiful minds with big hearts, which is rather the point of this column.

What has not changed

A client without a documented plan is a client without a map: the journey is perhaps exciting, but the destination is unknown and chosen by no one. When the values are known, the decisions are easy. Clients who could tell me what the money was for held their nerve in March 2020; those who could only tell me what it was worth generally did not. We are in the goal achievement business, not the market beating business, and beating the market while missing your goals is a poor trade.

A fiduciary's job is not to keep you comfortable. It is to speak the unspoken truth and sit opposite you when the noise is loudest. Some of the most valuable advice of the past decade fitted into two words: do nothing.

Evidence favours patience. Like a freshly poured beer, you do not drink it while it is all head. Let the froth settle. The investors who did best over the decade were rarely the cleverest in the room. They were the ones who repeatedly did the dull thing when it felt wrong.

Whatever you have built so far is the smaller half of the story. What matters is what is still in front of you, and whether it is engineered rather than merely hoped for.


* NZX 50 as at close on  Thursday, September 17 2026 = 13,756.59


Nick Stewart

(Ngāi Tahu, Ngāti Huirapa, Ngāti Māmoe,
Ngāti Waitaha)

Financial Adviser and CEO at Stewart Group

  • Stewart Group is a Hawke's Bay and Wellington based CEFEX & BCorp certified financial planning and advisory firm providing personal fiduciary services, Wealth Management, Risk Insurance & KiwiSaver scheme solutions.

  • The information provided, or any opinions expressed in this article, are of a general nature only and should not be construed or relied on as a recommendation to invest in a financial product or class of financial products. You should seek financial advice specific to your circumstances from a Financial Adviser before making any financial decisions. A disclosure statement can be obtained free of charge by calling 0800 878 961 or visit our website, www.stewartgroup.co.nz


Cheap Money has a Maturity Date

Article #474

In January 1672, Charles II stopped paying his creditors. 

The Stop of the Exchequer was announced as a temporary suspension. A delay, not a default. The distinction mattered a great deal to the Crown and not at all to the people who were owed the money. A borrower who cannot pay on the day they promised has defaulted, whatever the announcement calls it. 

The goldsmith bankers of Lombard Street, who had lent the Crown the money, were ruined. English government credit took a generation to recover. What eventually replaced it was something better than a king's promise: a funded national debt, the Bank of England in 1694, and a Parliament standing behind the borrowing rather than a monarch who could walk away from it. 

Over the century that followed, Britain outlasted Louis XIV and then Napoleon, both of whom governed larger and wealthier countries. Britain did not win because it was richer. It won because it could borrow more cheaply, for longer, and go on borrowing when its rivals could not. Creditworthiness turned out to be a weapon. 

The price of borrowing is not set by announcement. It is set at auction, by whoever turns up with capital and a choice about where to put it. Central banks can turn up too, and for a decade they did. But the auction reasserts itself the moment the official bid is withdrawn.

The OCR is not the whole story 

On 2 September the Reserve Bank lifted the Official Cash Rate to 2.75%, with annual inflation at 4.1% in the June quarter, driven largely by fuel prices flowing from the Middle East conflict [1]. 

The OCR sets the short end. It does not set the rate on a five-year term deposit, a two-year fixed mortgage, or a ten-year bond. Those price off wholesale rates, and wholesale rates are set in a global auction New Zealand does not run and cannot influence. 

A great many borrowers are turning up to that auction at once. 

Germany is funding a substantial military expansion by borrowing, with no corresponding retreat from its welfare state. Britain plans to expand its own. The bill for both goes to the same auction. The pattern repeats across the West, while the technology companies raise enormous sums to build artificial intelligence data centres. 

Nor is this only a Western habit, and China is the clearest case of a number that is not what it is announced to be. Beijing's headline deficit for 2026 is 4% of GDP. Once the CNY 4.4 trillion of local government special purpose bonds and the CNY 1.3 trillion of ultra-long special treasury bonds sitting outside that headline are counted, the consolidated deficit reaches a record 9.1% of GDP [2]. National debt is set to rise by close to CNY 14 trillion this year alone. 

The rate matters more than the level. Mark Williams, chief Asia economist at Capital Economics, calculates that China's total debt outside the financial sector has doubled as a share of GDP since 2010 and now tops 300%, putting its indebtedness, in his words, in a league of its own. The comparison most readers expect runs the other way. Broad American debt, public and private, has fallen as a share of GDP since 2010, to around 265% [3]. Nearly 40% of China's is owed by the public sector, local government financing vehicles included [3]. 

The numbers are not small. OECD central governments issued USD 17 trillion of bonds in 2025 and are projected to issue USD 18 trillion this year. Corporates added USD 6.8 trillion. All of it lands in a market where central banks, having spent a decade as the buyer of last resort, have stopped buying [4]. Local government sits in the same queue, one step removed, borrowing through agencies that price off the sovereign. 

More bonds offered, not proportionately more buyers at the same price, so the yield must rise to attract the capital. German ten-year yields are at their highest since 2011, Japanese yields have crossed 3%, and British gilts are at their highest since the financial crisis [5]. 

The honest counter-argument 

It would be tidy to say that governments and technology companies are crowding everybody else out, and leave it there. It would also be a little too tidy. 

Corporate borrowing did reach a record in 2025, USD 13.7 trillion raised across bond and syndicated loan markets, passing the 2021 peak. Nine large technology companies accounted for USD 122 billion of it, around 45% of all bond issuance by technology firms worldwide and more than three times the annual average since 2000. Yet the OECD's own assessment is that this came to no more than 15% of investment grade issuance by non-financial firms in the United States, and was absorbed without market-wide friction [6]. Capital markets are deep, and the pool is not fixed in the way the word crowding suggests. 

There is also a competing explanation for the move in yields that has nothing to do with supply at all. The oil price shock has reignited inflation expectations, and investors demanding more compensation for inflation will lift yields whether or not another bond is ever issued. 

Both explanations are probably doing some of the work. That is usually how markets behave, and anyone offering a single clean cause is selling something. What is not in dispute is the direction of travel, or that a borrower refinancing in 2029 will pay whatever the market asks in 2029, regardless of which explanation was correct. 

There is a second detail in the OECD data worth sitting with. Issuers have been shortening their maturities. In 2025 the ratio of bonds issued at thirty years and beyond, compared with those issued at one to five years, was the lowest since at least 2008 [4]. Short borrowing is cheaper today. It also means the debt comes back around sooner, and more often. That is a decision to pay less now, in exchange for finding out later. 

Cheap money has a maturity date 

A higher yield is not felt today. It is felt at maturity. 

Nearly 80% of what OECD governments borrow this year is not new spending at all. It is refinancing debt that already exists [4]. Borrowers who locked in cheap fixed rates a few years ago keep them right up to the day the debt rolls off and must be refinanced at whatever the auction is charging then. It will bite hardest where the debt is largest and the maturities shortest. Heavily indebted institutions are not repriced gradually. They are repriced in instalments, on a timetable set years ago by people who are frequently no longer there. 

New Zealand is not exempt. In March, Fitch revised New Zealand's outlook to negative while affirming the AA+ rating, forecasting general government debt at 56% of GDP by June 2027 and citing delayed fiscal consolidation [7]. Six days later the Local Government Funding Agency received the same revision, automatically, because as a government-related entity its rating is equalised with the Crown's [8]. LGFA provides most council borrowing in this country, Hastings included. 

Everyone drinks from the same pond.

Sovereigns, councils, banks, businesses, then the household. Different straws at different depths, the same water. Nobody in Taihape voted on the German defence budget. It is in the swap rate all the same, and the swap rate is in the mortgage at renewal. 

Milton Friedman's advice was to keep your eye on one thing only, how much government is spending, because that is the true tax. Thatcher put it less gently, that we have been ruled by men who live by the illusion that you can spend money you have not earned without eventually falling into the hands of your creditors. Whatever one makes of the politics, the arithmetic has not been repealed. The auction is where the bill arrives, and it arrives with interest. 

What this means for the investor 

For anyone with savings, this cuts both ways. 

After a decade of being told the coupon was a rounding error, it is worth having again. Income that had effectively disappeared from conservative portfolios has come back, and for retirees drawing on capital that is a meaningful improvement rather than a technical one. 

But a yield is not a gift. It is compensation, and the whole question is compensation for what. Credit quality, term, currency, and who stands behind the issuer. A bond paying more than the one beside it is priced that way for a reason, and the reason is rarely generosity. When someone offers a return well above the market for what they describe as much the same risk, one of those two claims is wrong, and it is not usually the return. 

Nor is the answer to reach for duration simply because longer bonds pay more today. Term is a risk, not a free lunch, and the investor who buys a long maturity to capture an extra sliver of yield has taken a view on the next decade of inflation whether they meant to or not. 

Bonds belong in a well-engineered portfolio. Not every bond belongs in yours. All bonds are equal, as Orwell might have put it, but some are more equal than others. 

Charles II discovered that credit, once lost, is not bought back. It is earned back, slowly, and usually by someone else's generation. The investor who reaches for yield without asking what it is paying for learns a smaller version of the same lesson. That question is easier to answer when the person answering it is bound by duty to put your interests before their own.


Nick Stewart

(Ngāi Tahu, Ngāti Huirapa, Ngāti Māmoe,
Ngāti Waitaha)

Financial Adviser and CEO at Stewart Group

  • Stewart Group is a Hawke's Bay and Wellington based CEFEX & BCorp certified financial planning and advisory firm providing personal fiduciary services, Wealth Management, Risk Insurance & KiwiSaver scheme solutions.

  • The information provided, or any opinions expressed in this article, are of a general nature only and should not be construed or relied on as a recommendation to invest in a financial product or class of financial products. You should seek financial advice specific to your circumstances from a Financial Adviser before making any financial decisions. A disclosure statement can be obtained free of charge by calling 0800 878 961 or visit our website, www.stewartgroup.co.nz


References 

1. Reserve Bank of New Zealand (2 September 2026). OCR increased by 25 basis points to 2.75%. https://www.rbnz.govt.nz/news-and-events/news/2026/09/ocr-increased-by-25-basis-points-to-2-75 

2. China Power Project, Center for Strategic and International Studies (2026). Making Sense of China's Government Budget. https://chinapower.csis.org/making-sense-of-chinas-government-budget/ 

3. Fortune (11 May 2026). Forget US debt, China's total borrowing is in a league of its own. https://fortune.com/2026/05/11/us-debt-china-total-borrowing-public-private-gdp-ratio-lgfv/ 

4. OECD (2026). Global Debt Report 2026: The investor base for government and corporate bond markets. https://www.oecd.org/en/publications/global-debt-report-2026_e9d80efd-en/full-report/the-investor-base-for-government-and-corporate-bond-markets_e68b90b3.html 

5. CNBC (3 September 2026). Global bond yields rising: Treasuries, JGB, Bunds. https://www.cnbc.com/2026/09/03/global-bond-yields-rising-treasuries-jgb-bunds.html 

6. OECD (2026). Global Debt Report 2026: Corporate debt market outlook in a transforming world. https://www.oecd.org/en/publications/global-debt-report-2026_e9d80efd-en/full-report/corporate-debt-market-outlook-in-a-transforming-world_cf86a220.html 

7. Fitch Ratings (20 March 2026). Fitch revises outlook on New Zealand to negative; affirms at AA+. https://www.fitchratings.com/research/sovereigns/fitch-revises-outlook-on-new-zealand-to-negative-affirms-at-aa-20-03-2026 

8. New Zealand Local Government Funding Agency (26 March 2026). Credit Rating Outlook Revised to Negative by Fitch Ratings. NZX announcement. https://announcements.nzx.com/announcement/469979 


The Trains Ran but the Dividends Did Not

Article #472

In August 1845 the index of British railway shares stood at 1,984. By April 1850 it was 673. [1]

What makes the Railway Mania worth remembering is not that it was a swindle, largely it was not. The technology was real, and what the money built is still there.

Parliament authorised thousands of miles of new line and the network more than tripled by 1850. At the peak, railway construction ran close to seven percent of national income, roughly half of all capital formation in the country. About a third of the authorised lines were never built. The rest ran for a century and a half. [2]

The story was right. The shareholders were still ruined. Clergymen, widows, country solicitors, Charlotte Bronte. People not greedy so much as correct about the future and wrong about the price. Something similar has just finished happening in China.

What China was promised, and what it delivered

Ten years ago, the story almost wrote itself. China would overtake the United States, and its currency would take a seat among the world’s reserve currencies. On 1 October 2016, the renminbi was fast tracked into the IMF’s Special Drawing Rights basket. [3]

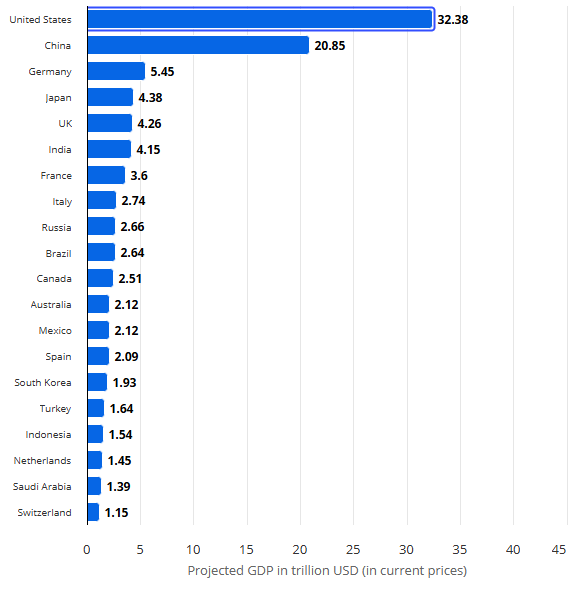
The growth half largely came true. China’s economy grew from roughly USD 11 trillion in 2015 to USD 19.63 trillion in 2025, and is expected to cross USD 20 trillion this year. [4] Seventy percent in a decade, off an already enormous base.

The other half did not. It did not overtake the United States, which reached USD 30.77 trillion in 2025, and the IMF has quietly cut its own 2030 projection for China from USD 27.5 trillion to USD 23.1 trillion. [4] [12] Still, anyone who bought the growth story in 2015 was not badly wrong about growth. The mistake was assuming that national growth would translate cleanly into shareholder return.

Source: Statista | Largest economies worldwide 2026

What the shareholders got

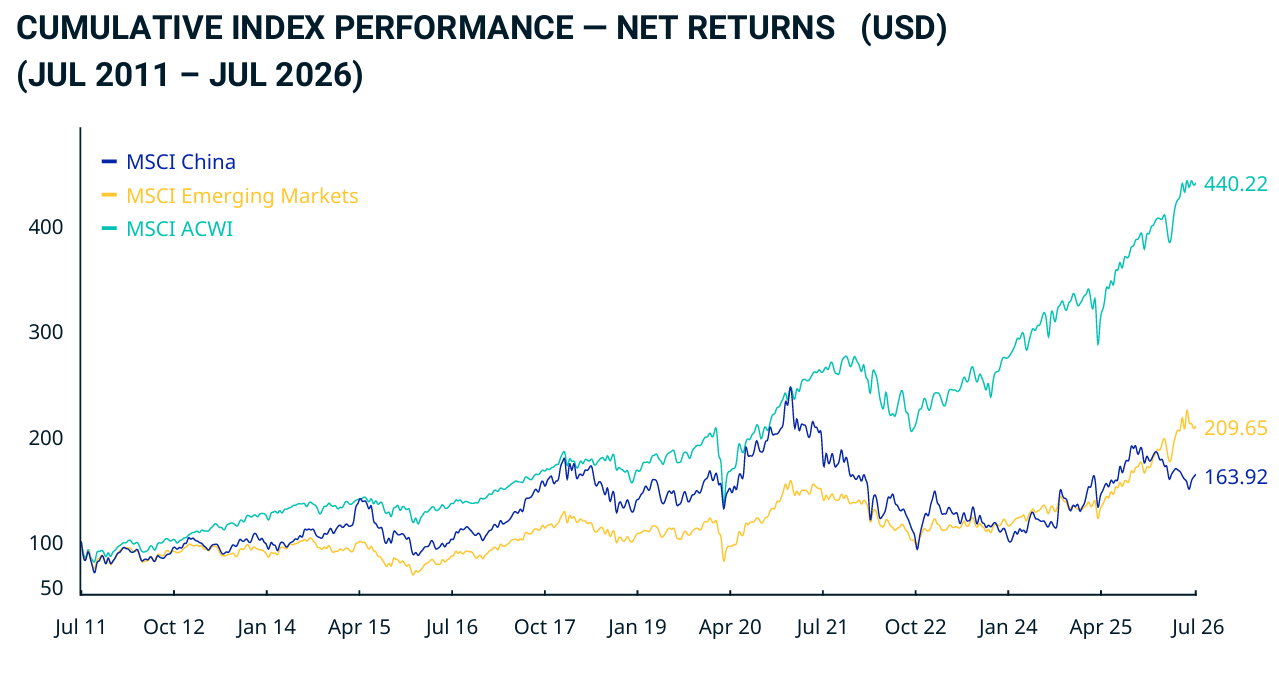
For the period to 31 July 2026, the MSCI China Index returned minus 2.13% a year over five years and 4.88% a year over ten. These are net returns, after the withholding tax a foreign investor actually pays. Compounded, the five-year result is a cumulative loss of about 10.2%. [5]

Over the same periods, the MSCI All Country World Index returned 10.85% and 12.32% a year, while emerging markets returned 8.03% and 9.19%. [5] Put simply, a dollar in the world index grew to about USD 1.67. A dollar in China became about USD 0.90.

China did not merely lag the Americans, which is the comparison everyone reaches for. It lagged the emerging world it was supposed to be leading.

Nor is the ten-year figure as flattering as it looks. It was rescued by two strong years at the end.

Explore the full MSCI China Index Factsheet HERE

The middle of the period is where the damage was done. The index fell 21.72% in 2021, 21.93% in 2022 and 11.20% in 2023. [5] Together, those three losing years compounded to a cumulative loss of nearly 46%. A dollar invested at the start of 2021 was worth about USD 0.54 by the end of 2023.

The recoveries of 2024 and 2025, at 19.42% and 31.17%, look handsome in isolation. They are the arithmetic of climbing out of a hole. A 46% fall needs an 85% gain simply to get back to even.

Note what the ride cost. Over those five years, the index carried an annualised standard deviation of 27.89%, against 15.07% for the world index, and a Sharpe ratio of minus 0.08 against 0.53. [5] In plain English, China delivered nearly double the volatility and still a negative return. Investors were not paid for the risk. They paid for it.

An investor who bought at the loudest point fared worse still. The Shanghai Composite peaked at 5,166 on 12 June 2015 and, eleven years on, has not been back. [9]

The currency that never arrived

The reserve-currency promise is the cleaner failure, because it was measurable from the start. In the first quarter of 2026, the renminbi accounted for 1.99% of global foreign exchange reserves, down from 2.18% at the end of 2024 after dipping to 1.92% in the third quarter of 2025. The US dollar sat at 57.13%, and the euro at 20.03%. [6]

The IMF attributes most of the latest uptick to exchange-rate valuation rather than to reserve managers buying, and COFER revises prior quarters as reporting is corrected. [6] The useful reading is the broad trend, not the second decimal place: flat to down across a decade of ambition. Reserve managers proved unwilling to hold a currency they could not move freely.

New Zealand's exposure was in the order book

For New Zealand, the direct investment loss was probably not the main story. Very few New Zealanders held Chinese shares directly. Our exposure arrived through customers rather than the share register, which is harder to rebalance because nobody runs an annual review on their order book.

Wine is the clean example. Shipments to China rose 47% in the year to mid 2025, to $56 million, against total wine exports of $2.10 billion. [7] Volumes are climbing again this year, but prices are falling, with a bulk wine price war running through Marlborough as a record harvest looks for a home. [8]

The saviour story turned out to be champagne without the fizz. The litres arrived. The dollars did not.

The point runs past wine. A grower or packhouse built around one fast-growing market holds a concentrated position as real as any portfolio holding, and far less liquid. Plantings take years to come into production, and cool stores, packing lines and market accreditation are not reallocated over a weekend.

Worse, that exposure correlates with everything else on the balance sheet. Land value, the borrowing secured against it, the labour bill and forward sales all move in the same direction. When the market that was going to take everything decides to pay less, the hit lands everywhere at once.

The order book is the least diversified asset most owners have, and the only one they rarely review as an investment risk. If the business is already a concentrated bet on one market, the owner’s portfolio has no business becoming a second concentrated bet on the same story.

The grain of truth

The other side deserves its best case. Chinese shares are cheap: 14.09 times trailing earnings against 23.24 for the world index, 10.97 times forward earnings against 17.13, and a dividend yield of 2.26% against 1.59%. [5] Shanghai also posted its strongest year since 2020 and touched decade highs in March 2026. [9]

The trouble is that cheapness has been available the whole way down. China traded at a discount for most of the decade, and for much of it the discount widened. That did not stop 2021, or 2022, or 2023. A low multiple is not a floor. It is the market pricing risk, and sometimes it prices that risk correctly.

Nor should the recent strength be mistaken for a full recovery. The rest of the world ran hard over the same stretch, so China has closed no gap, and the five-year number is still negative after it. Selling today solely because of the last five years would repeat the 2015 error in reverse. The direction changes. The mistake does not.

Evidence favours patience. Let the froth settle before committing, like a freshly poured beer you do not drink while it is all head.

The fiduciary question

The plain question is who was telling you the story, and what they were holding while they told it. Growth narratives sell funds, conference tickets and column inches. That is not a conspiracy; it is how incentives work. But none of those people were in your portfolio when the five-year number came in negative.

A fiduciary has the less enjoyable job of saying that a good story and a good investment are not the same thing, and that the gap between them is where most money is lost.

A frog in a well

Sun Tzu put it plainly. A victorious army wins first and then goes to battle, while a defeated army goes to battle first and then looks for the victory. [10] The asset allocation is settled before the market does anything.

Calling economic growth a return does not make it a return.

The trains ran. The dividends did not. Both things were true at once in 1850, and both have been true again.

So before the next irresistible story arrives, seek advice and wise counsel. Remember what Zhuangzi wrote some twenty-three centuries ago: a frog in a well cannot be talked with about the sea, for he is confined to the limits of his hole. [11]

The frog was not wrong about his well. The well was real. It simply was not the ocean.


Nick Stewart

(Ngāi Tahu, Ngāti Huirapa, Ngāti Māmoe,
Ngāti Waitaha)

Financial Adviser and CEO at Stewart Group

  • Stewart Group is a Hawke's Bay and Wellington based CEFEX & BCorp certified financial planning and advisory firm providing personal fiduciary services, Wealth Management, Risk Insurance & KiwiSaver scheme solutions.

  • The information provided, or any opinions expressed in this article, are of a general nature only and should not be construed or relied on as a recommendation to invest in a financial product or class of financial products. You should seek financial advice specific to your circumstances from a Financial Adviser before making any financial decisions. A disclosure statement can be obtained free of charge by calling 0800 878 961 or visit our website, www.stewartgroup.co.nz


References

1. Campbell, G. and Turner, J.D. (2012). Dispelling the Myth of the Naive Investor during the British Railway Mania, 1845-1846. Business History Review, 86(1). Railway share price index at 1,984 in August 1845, falling to 673 by April 1850.

2. Arnold, A.J. and McCartney, S. (2022). Managerial Failure in early Victorian Britain: Network and capital expansion during the Railway Mania. Business History. Network reached 6,621 miles by 1850, tripled since 1844; railway capital formation near 7% of GDP in 1847; about a third of authorised lines never built.

3. International Monetary Fund. Currency Composition of Official Foreign Exchange Reserves (COFER), dataset notes. The renminbi has been separately identified in COFER from 2016Q4, following its inclusion in the Special Drawing Rights basket on 1 October 2016.

4. International Monetary Fund, World Economic Outlook, as compiled by Statista and Worldometer. China nominal GDP of USD 19.63 trillion (2025) and an estimated USD 20.85 trillion (2026); United States USD 30.77 trillion (2025).

5. MSCI (2026). MSCI China Index (USD) Index Factsheet, data as at 31 July 2026. Net returns in USD: MSCI China five year minus 2.13% and ten year 4.88% annualised; MSCI ACWI 10.85% and 12.32%; MSCI Emerging Markets 8.03% and 9.19%. Annual net returns 2021 minus 21.72%, 2022 minus 21.93%, 2023 minus 11.20%, 2024 19.42%, 2025 31.17%. Fundamentals: MSCI China P/E 14.09, forward P/E 10.97, dividend yield 2.26%; MSCI ACWI P/E 23.24, forward P/E 17.13, dividend yield 1.59%. Five year annualised standard deviation 27.89% against 15.07% for MSCI ACWI; five year Sharpe ratio minus 0.08 against 0.53.

6. International Monetary Fund (1 July 2026). IMF Data Brief: Currency Composition of Official Foreign Exchange Reserves, World Aggregates, First Quarter 2026. Renminbi 1.99% (from 1.95% in 2025Q4), US dollar 57.13%, euro 20.03%. Earlier briefs give the renminbi at 2.18% in 2024Q4 and 1.92% in 2025Q3. COFER revises prior quarters as reporting is corrected.

7. New Zealand Winegrowers (2025). Annual Report 2025. Exports to China up 47% to $56 million; total wine exports $2.10 billion.

8. Vino Joy News (July 2026). China's white wine boom has triggered a Marlborough price war.

9. Shanghai Stock Exchange data via CEIC and Trading Economics; Global Times (January 2026) reporting the Shanghai Composite's 18.41% gain in 2025 and its return to decade highs.

10. Sun Tzu, The Art of War, Chapter 4, Tactical Dispositions. Rendered by Thomas Cleary as: a victorious army first wins and then seeks battle; a defeated army first battles and then seeks victory.

11. Zhuangzi, Outer Chapters, The Floods of Autumn (Qiushui), 4th century BCE. James Legge translation: a frog in a well cannot be talked with about the sea, he is confined to the limits of his hole.

12. ChinaPower Project, Center for Strategic and International Studies (2026). Unpacking China's GDP. IMF projection for China in 2030 revised from USD 27.5 trillion (April 2023) to USD 23.1 trillion (April 2025).


Don't Buy All You Can Borrow

Article #471

Your parents lied to you.

Not about Santa Claus, or carrots improving your eyesight, or the dog going to live on a farm. About something far more expensive, and something you probably did with a pen in your hand and a banker smiling across a desk.

“Buy the best house you can afford,” they said, somewhere between the roast lamb and the pavlova. “Property always goes up.” They smiled knowingly, the way parents do when they think they have just handed you the map to the treasure.

They handed you a map, alright. To a different kind of buried thing entirely.

There is a peculiarly New Zealand religion around property, and we are its most devoted congregation. We flip through TradeMe listings the way other cultures read scripture, and attend open homes on Saturdays like it is church. We have been raised to believe that the house is the thing. The bigger the better. Stretch for it. The bank will say yes.

And the bank will say yes. That is precisely the problem. Banks are not your parents and they are not your friends. They exist to extract a return from the spread between what they pay for money and what they charge you for it, and are content to lend you every last dollar you can theoretically service. The bank's interest is not your interest. Literally.

Property Always Goes Up

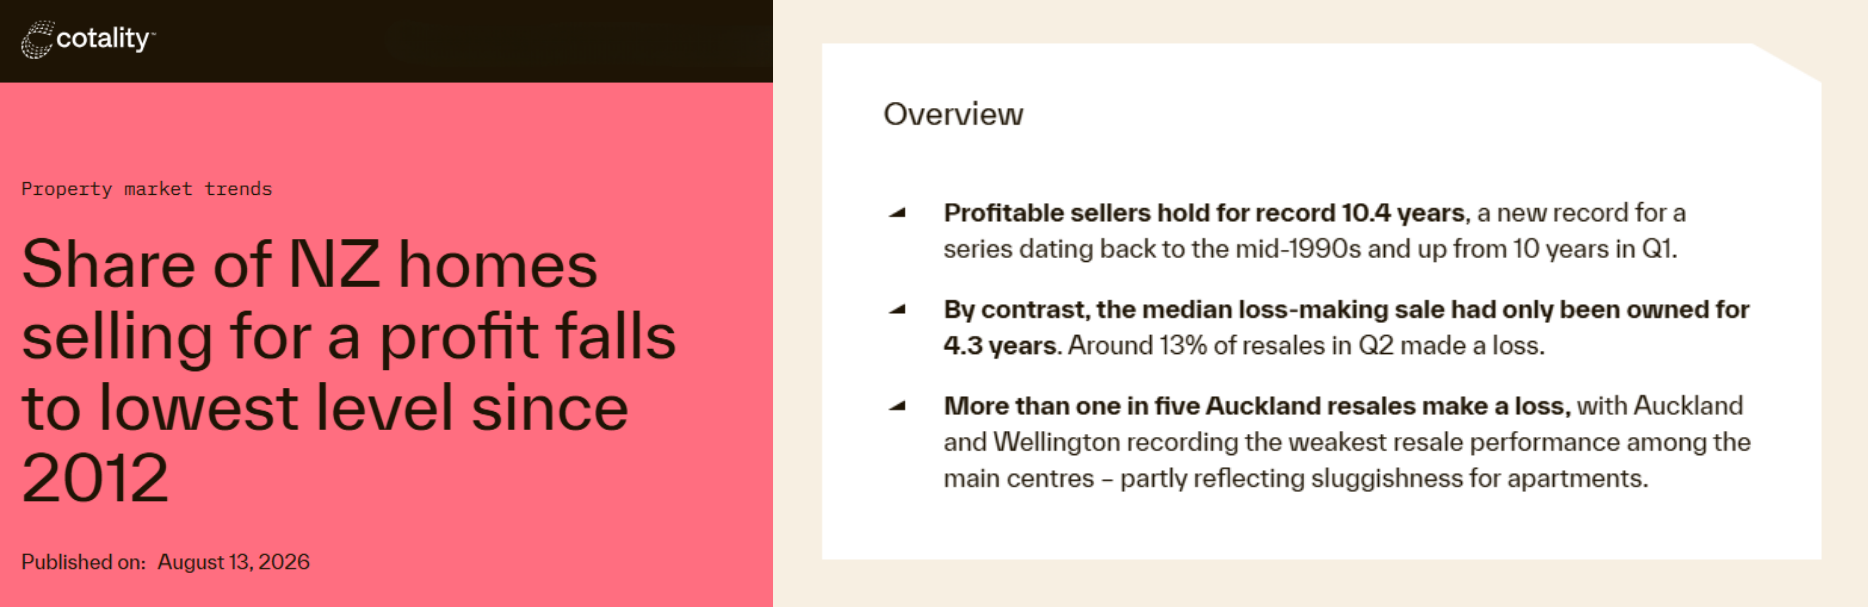
Except when it does not. Cotality data released this month shows that in the second quarter of 2026, 13.1% of New Zealand homes resold at a loss, the highest since 2012, at a median $60,000 below purchase price and $159 million across the quarter. Investors fared worst at 13.5%, against 12.2% for owner-occupiers.[1] In fairness, 86.9% still resold at a gross profit, so this is a slide rather than a rout, and it has come without the mortgagee sales of the global financial crisis.

Source: Cotality | Explore Insights and Report HERE

But the number that matters most for this argument is the hold period. Profitable resales had been owned for a median of 10.4 years, a record high. Loss-making resales, 4.3 years.[1]

That is the whole case in two figures. Time rescues a property purchase, and borrowing to the absolute ceiling is what takes time away from you, because when the rate cycle turns or the premium arrives or the job changes, you sell when you must rather than when you choose. The buffer is not a luxury. The buffer is the hold period.

The counter-case deserves an honest hearing. Property has, over long periods, rewarded those who bought as much as they could as early as they could, while inflation eroded their debt. That is true, and it is also survivorship talking. The three conditions that made maximum leverage work, being falling interest rates, cheap and available insurance, and council rates rising near inflation, have now reversed at once.

The Rate Rollercoaster

Between November 2021 and May 2023 the Reserve Bank lifted the OCR from a record low 0.25% to 5.50%, and by January 2024 the average one-year fixed rate had climbed to 7.5% from 2.58%.[2] Households borrowed to the maximum of their serviceability were suddenly underwater. Rates came down through 2025 as the Bank cut nine times to 2.25%.[3] On 8 July 2026 it raised the OCR for the first time in three years.[4] The cycle is shorter than anyone expected.

Source: www.rbnz.govt.nz/statistics - New residential mortgage standard interest rates

Then Comes the Insurance Bill

House insurance averaged $2,815 in the final quarter of 2025, a 37% jump in three years, and Consumer NZ puts the rise at three times general inflation since 2011.[5,6,7]

Explore the full Consumer Insurance Report HERE

But price is no longer the whole story. Availability is, and that is a different order of problem. A premium is a negotiation. A refusal is a wall. You cannot get a mortgage without insurance, so a house that cannot be insured cannot really be sold. The valuation does not fall because the building changed. It falls because the finance did.

In January 2026 AA Insurance told the Buller District Mayor it would stop issuing new home, business and landlord policies across the postcode covering Westport, Carters Beach and Cape Foulwind.[8] Existing customers could renew. New buyers could not get cover at all. Within weeks it paused new policies in Woodend, citing seismic exposure rather than flood, then declined new business across Blenheim, Renwick and Seddon.[9] Legal commentators call this the beginning of a new kind of insurance retreat.[10] AA Insurance was simply the one that announced it. Others declined quietly.

Closer to Home

In April 2026 it emerged that Tower Insurance was refusing to cover some homes in Parklands Residential Estate, a modern council-owned development near Park Island in Napier. Buyers entering estate addresses into Tower's website were told cover could not be offered, the insurer citing a high risk of flooding from sea surge.[11]

These are new homes, with ground levels the council says were set above significant storm surge scenarios. And yet a major insurer would not touch them. Napier City Council is meanwhile spending $37.4 million on stormwater to protect Te Awa and Maraenui.[12] Public money, directed at a problem an insurer had already priced into its underwriting.

Cyclone Gabrielle caused $2.17 billion in insurance losses across this region, and the review that followed found new housing in areas of known flood risk suggested past lessons had not been learned.[13,14] Nobody mentioned any of this at the open home. Before you sign, enter the address into an insurer's website, read the LIM, and look at the flood hazard maps. That is the due diligence our open-home culture trains us to skip in favour of admiring the benchtops.

And Then There Are Rates

Not mortgage rates. Council rates, which are moving the same way. Stats NZ has local authority rates and payments up 8.8% in the year to March 2026, against headline inflation of 3.1%, and rates were the single largest contributor to that inflation figure.[15] Where water charges are shifting to a separate delivery entity under Local Water Done Well, the number on the rates notice is no longer the number leaving your account.

One More Thing: The Election

Every party to the left of centre now favours taxing property in some form. The differences are of instrument and degree, not direction.

Labour is campaigning on a 28% capital gains tax covering residential investment and commercial property, applying only to gains made after 1 July 2027, with the family home, farms, shares and KiwiSaver exempt. It would replace the bright-line test.[16,18]

The Greens go further, proposing a 2.5% annual super-rich tax on net assets above $10 million per individual, and a Capital Acquisitions Tax charging 33% on inheritances and gifts received above a lifetime threshold of $1 million, with family homes and family farms carved out and the tax paid by the recipient rather than the estate.[17] Opportunity, formerly TOP, proposes a land value tax of 1.75% urban and 0.5% rural.[19]

Te Pāti Māori has not published its 2026 tax policy, so its numbers for this election are not known. The direction is. The party campaigned in 2023 on a wealth tax rising to 8% on net wealth above $10 million, a 2% annual levy on property appreciation and taxes on undeveloped and vacant land, and KPMG counts it among those pressing for structural reform this time round.[16,20] Treat the 2023 figures as history rather than policy until the manifesto lands.

National, ACT and NZ First are not the mirror image of this. Neither proposes new property taxes, and their emphasis is on lower-tax settings and targeted reforms to boost investment.[16] That is closer to holding the current line than reversing it, and the current line is already favourable, with the bright-line test back to two years since July 2024 and full interest deductibility restored from April 2025. Their position is continuity, not a counter-offer.

KPMG notes that a capital gains tax is now the common denominator across the likely alternative government, although Chris Hipkins has ruled out Labour backing a wealth or inheritance tax.[16] None of it is law, and coalition negotiation will decide what any of it looks like. Voters decide on 7 November. But on one side of the House the direction of travel points squarely at property, and on the other it does not move at all.

What the Buffer Actually Buys

Take two buyers on the same street and the same income. One borrows $900,000 against a $1.05 million house. The other borrows $700,000 against an $850,000 house ten minutes further out. At 5.5% over thirty years, the gap in repayments is roughly $1,100 a month.

Nothing separates them while conditions hold. The difference appears when something moves. A one percentage point rise on $900,000 costs about $9,000 a year, against $7,000 on $700,000. A 37% jump in the premium lands on a household that has $1,100 a month of room, or on one that has none. A redundancy is a difficult year for one and a forced sale for the other.

That $200,000 was never really about the house. It was about buying the ability to wait, and the resale data says waiting is the whole game.

The Boring Alternative

Buy less than you can borrow. Keep a buffer. Sleep at night.

The house ten minutes further from the school zone that costs $200,000 less is not a failure. It is a margin of safety, and more to the point it is time. It is the difference between selling at 4.3 years because you have to and holding for 10.4 years because you can. It is the room to fix the roof without going back to the bank, and to stop doing anxious arithmetic at 2am. If you think professional advice is expensive, try using an amateur.

Property can be a wonderful long-term asset. But the best house you can afford is not the best house for you. It is just the biggest risk you were allowed to take.

The bank will tell you what you can borrow, not what you should. For that, seek impartial advice and wise counsel.


Nick Stewart

(Ngāi Tahu, Ngāti Huirapa, Ngāti Māmoe,
Ngāti Waitaha)

Financial Adviser and CEO at Stewart Group

  • Stewart Group is a Hawke's Bay and Wellington based CEFEX & BCorp certified financial planning and advisory firm providing personal fiduciary services, Wealth Management, Risk Insurance & KiwiSaver scheme solutions.

  • The information provided, or any opinions expressed in this article, are of a general nature only and should not be construed or relied on as a recommendation to invest in a financial product or class of financial products. You should seek financial advice specific to your circumstances from a Financial Adviser before making any financial decisions. A disclosure statement can be obtained free of charge by calling 0800 878 961 or visit our website, www.stewartgroup.co.nz


References

1. Cotality - Share of NZ Homes Selling for a Profit Falls to Lowest Level Since 2012. cotality.com/nz, 17 August 2026. https://www.cotality.com/nz/insights/articles/share-of-nz-homes-selling-for-a-profit-falls-to-lowest-level-since-2012

2. Mortgage Express NZ - Is Now the Right Time to Lock in Your Home Loan Rate? mortgage-express.co.nz

3. Canstar NZ - In Which Direction Are Mortgage Interest Rates Headed? canstar.co.nz, June 2026

4. Reserve Bank of New Zealand - Official Cash Rate raised 25 basis points to 2.50%, 8 July 2026. rbnz.govt.nz

5. Quashed - Why Is My House Insurance So Expensive? 2026 NZ Premium Hike Guide. quashed.co.nz

6. Reserve Bank of New Zealand - Insurance Availability and Risk-Based Pricing, Financial Stability Report, May 2024. rbnz.govt.nz

7. Consumer NZ - What's Going On With Home Insurance? consumer.org.nz, February 2026

8. RNZ - Insurer Temporarily Halts New Policies in Westport Due to Flood Risk. rnz.co.nz, 28 January 2026

9. NZ Herald - Major Insurer Declines New Home Insurance Policies for Blenheim. nzherald.co.nz, 3 February 2026

10. Minter Ellison - Insurers Dial Back Flood Risk Exposure: Where Will This Lead? minterellison.co.nz, May 2026

11. 1News - Insurer Flags Sea Surge Risk for Some Napier Estate Properties. 1news.co.nz, April 2026

12. Napier City Council - $37.4M Stormwater Investment Unlocks 400 Homes and Flood Protection for Napier. napier.govt.nz, December 2025

13. Insurance Business NZ - Hawke's Bay Homeowners Face Insurance Woes, Rising Security Risks. insurancebusinessmag.com, November 2024

14. Insurance Business NZ - Hawke's Bay Flood Review Highlights Need for Improved Risk Management. insurancebusinessmag.com, July 2024

15. Stats NZ - Annual Inflation at 3.1 Percent in March 2026: Local Authority Rates and Payments Up 8.8 Percent. stats.govt.nz, April 2026

16. KPMG New Zealand - Summary of 2026 Election Tax Policies. kpmg.com/nz, August 2026

17. 1News - Greens Propose Wealth, Inheritance Taxes to Fund Income Tax Changes. 1news.co.nz, 21 June 2026

18. Buddle Findlay - Labour's Capital Gains Tax: Time to Think Ahead. buddlefindlay.com, 2026

19. The Post - Opportunity Party Reveals Policies on Land Tax, Universal Basic Income and KiwiSaver Reform. thepost.co.nz, May 2026

20. RNZ - Te Pāti Māori Proposes Suite of Changes in New Tax Policies. rnz.co.nz, 27 July 2023. No 2026 tax policy published as at 20 August 2026


The Mozart Problem and the Bill New Zealand Keeps Refusing to Read

Article #470

Everything costs more, yet by every measurable standard, we are producing less. Welcome to Baumol's cost disease, with a Wellington twist. 

Picture a string quartet performing Mozart in 1790. Four musicians, half an hour, a finished piece of music. Now picture the same quartet performing the same piece in 2026. Four musicians, half an hour, the same music. 

The output is identical. The cost is not. 

This is Baumol's cost disease - economist William Baumol's 1966 observation that some sectors cannot get more productive no matter how clever you are [1]. You cannot ask the violinists to play twice as fast. Yet they must still be paid enough not to quit and retrain as software engineers. And engineers' wages keep rising because their productivity does. So performing the piece costs more every decade, while the performance itself never changes. 

Baumol's insight was never an argument against paying the violinist. It was a warning about where the money comes from. Rising wages in less productive sectors are affordable only because a productive sector somewhere is generating the surplus to fund them. Pull out the productive sector and the whole arrangement stops being generosity and starts being arithmetic. 

Which brings us to the Wellington twist. We have the disease. We do not have the cure. 

The number that is not moving 

On 1 April, the adult minimum wage rose again, to $23.95 an hour, up 45 cents, a 'moderate' two percent lift the government was quick to call balanced [2]. On the same day, main benefits rose 3.11 percent, indexed to the CPI. New Zealand Superannuation lifted 2.9 percent, indexed to wages. The default KiwiSaver contribution ticked up to 3.5 percent. The living wage moved to $29.90 an hour. The government indexed its obligations, sent out the press releases, and moved on. 

Businesses do not get to index theirs. They just get the obligation, and the bill that comes with it. 

Here is the part nobody in Wellington wants to say out loud. Stats NZ's own figures show multifactor productivity fell 0.9 percent in the year to March 2025 [3]. Labour productivity nudged up 0.8 percent, but only because firms shed workers faster than output dropped [3]. We did not get more productive. We got smaller, slightly less inefficiently. 

Our labour productivity gap with the top half of the OECD has widened from 34 percent in 1996 to roughly 40 percent today [4]. We sit alongside Mexico, Greece and Portugal [5]. Construction is the starkest case of all: the sector is producing at roughly the same rate it managed in 1985 [6]. Four decades of technology, and the shed goes up at the same speed. 

Baumol's violinist was paid out of a surplus the rest of the economy threw off. Ours is paid out of an economy that has stopped producing one. Every April the floor climbs. The output that is meant to fund it goes sideways at best. The gap does not close. It compounds.

Source: NZCBIA Report No 2024-01

California told us how this ends 

In April 2024, California lifted the minimum wage for large fast-food chains from USD 16 to USD 20 an hour: a 25 percent jump and one of the biggest single-sector hikes in American history [7]. The most rigorous peer-reviewed study to date found the sector shed around 18,000 jobs in the first year, roughly a 3.2 percent fall relative to the rest of the country [7]. 

But the more telling story is what came next. Two years on, researchers tracking the same restaurants found the damage had changed shape. Workers kept their jobs but lost hours, lost overtime, and increasingly lost out to a kiosk [8]. One franchise group saw shift work fall by more than 20 percent. Another chain cut labour hours across its outlets by nearly 12 percent [8]. 

The wage floor did not lift those workers so much as quietly saw off the bottom rung of the ladder they were standing on. 

This is not an argument that people should be paid less. It is an observation about what happens when the price of labour is set by decree rather than by what that labour can produce, and about who gets hurt when the two drift apart. It is never the people who set the number. 

What Baumol never saw coming 

For sixty years, cost disease was incurable precisely because you could not automate the quartet. The violinist was safe. So was the waiter, the till operator, the aged-care worker. Their inefficiency was their job security. 

AI is the first technology that credibly threatens that assumption, and it arrives at the exact moment the wage floor is climbing [9]. The jobs most exposed to a rising minimum (entry-level, routine, repeatable) are precisely the jobs AI is coming for first [9]. In California, the same franchises facing the higher wage bill were the ones rolling out ordering kiosks, app ordering and AI drive-throughs fastest.8 Raise the cost of the role and hand the employer a cheaper substitute in the same quarter, and you do not need an economics degree to see which way that goes. 

The 17-year-old looking for a first job is now competing not just with a higher wage bill, but with a piece of software that never calls in sick, never takes a smoko break, and never asks for a raise. 

Slicing versus baking 

Which brings us to November. 

Here is what the election will be about, and what it should be about, and they are not the same thing. 

Every party will campaign on how to slice the pie. Who pays more tax and who pays less. Who gets the transfer, the credit, the exemption. Where the floor should sit and how fast it should rise. It is a rich, noisy, deeply satisfying argument, and it will absorb the entire campaign. 

Almost nobody will campaign on baking a bigger pie. 

Yet the pie is the whole argument. A minimum wage is affordable when output is rising, because there is more to go round and the violinist gets paid out of the surplus. When output is flat, the same policy is not generosity. It is a redistribution of a pie that is not growing, and someone at the margin - usually the least skilled, the youngest, the last hired - pays for it without ever being told they are paying [10]. 

We even had a Productivity Commission. Set up in 2010 at ACT's insistence to ask precisely this question, it drifted - by the end it was inquiring into immigration settings and just transitions, and ACT itself abolished it in 2024, and nobody much mourned [11 The one body built to ask how we bake a bigger pie had spent its final years arguing about slices. That is the country in miniature. 

So here is the question worth putting to whoever knocks on your door between now and 7 November: not what will you lift, but what will you grow? What, specifically, will be more productive in three years than it is today, and how will you know? 

If the reply is a slogan, you have your answer. 

What this means for you 

If you own a business: stress-test your margins against a wage line that rises every April whether or not your revenue does. Automation is no longer an efficiency play. It is defensive. 

If you invest: sectors leaning hardest on minimum-wage labour - hospitality, retail, aged care - carry a structural cost risk that never shows up in a glossy prospectus. Price it in. 

If you are a parent: the entry-level job your kids would once have used to get a foot in the door is the one most at risk. Have a Plan B for how they build experience when the first rung keeps getting sawn off. 

The government can index its obligations every April and move on. Businesses cannot. 

They will tell you a rising tide lifts all boats. They never mention the ones still tied to the wharf. And every April, the tide comes in a little higher. The trouble is, the businesses are anchored, and the school-leavers cannot swim yet.


Nick Stewart

(Ngāi Tahu, Ngāti Huirapa, Ngāti Māmoe,
Ngāti Waitaha)

Financial Adviser and CEO at Stewart Group

  • Stewart Group is a Hawke's Bay and Wellington based CEFEX & BCorp certified financial planning and advisory firm providing personal fiduciary services, Wealth Management, Risk Insurance & KiwiSaver scheme solutions.

  • The information provided, or any opinions expressed in this article, are of a general nature only and should not be construed or relied on as a recommendation to invest in a financial product or class of financial products. You should seek financial advice specific to your circumstances from a Financial Adviser before making any financial decisions. A disclosure statement can be obtained free of charge by calling 0800 878 961 or visit our website, www.stewartgroup.co.nz


References 

  1. Baumol, W. J., and Bowen, W. G., Performing Arts: The Economic Dilemma: A Study of Problems Common to Theater, Opera, Music, and Dance, Twentieth Century Fund, 1966. 

  2. Beehive.govt.nz, Minimum Wage Increase Balances Business and Worker Needs, 12 December 2025; Employment New Zealand, Minimum Wage Is Increasing on 1 April 2026, 9 March 2026. 

  3. Stats NZ, Productivity Statistics: 1978–2025, 23 April 2026. 

  4. BERL, Relooking at Our Productivity Gap, 2024. 

  5. MBIE and MFAT, New Zealand's Productivity in a Changing World: Long-Term Insights Briefing, 17 December 2025. 

  6. Newsroom, Construction Sector Productivity Stuck in '80s, 9 August 2024; Beehive.govt.nz, Construction Sector Productivity the Same as 1985, 9 August 2024. 

  7. Clemens, J., Edwards, O., and Meer, J., “Did California's Fast Food Minimum Wage Reduce Employment?”, NBER Working Paper No. 34033, July 2025. 

  8. Owen, S., Ripley-Rodriguez, E., Jenkins, M., Walsh, S., and Tang, K., Let Them Eat Big Macs, Crunch Wraps, and Whoppers: A Working Paper Describing the Statewide Impact of California's $20 Fast Food Minimum Wage, University of California, Santa Cruz Institute for Social Transformation, November 2025. 

  9. IDC / Deel, AI at Work: The Role of AI in the Global Workforce, November 2025. 

  10. Stats NZ, Unemployment Rate at 5.3 Percent in the September 2025 Quarter, 5 November 2025. 

  11. New Zealand Government, New Zealand Productivity Commission Act Repeal Act 2024, New Zealand Legislation, 2024. 


No Taxation Without Representation: The CCO Accountability Gap

Article #460

Last weekend we marked King's Birthday - the official birthday of a man none of us voted for, none of us can remove, and most of us will never meet. The monarchy survives on charm, inertia, and a constitutional bargain held for centuries: the King reigns on the condition he does not rule.

The same cannot be said of our Council-Controlled Organisations. In three weeks' time, that contrast becomes expensive.

Last October, New Zealanders voted in 42 simultaneous referendums on Māori wards. 24 councils voted to remove them and 18 to keep them. Nationally, more than 542,000 voters supported retaining Māori wards against around 468,000 who opposed them. Whatever your view, the principle was clear: how local democratic representation is structured is important enough for voters to decide directly.

Now apply the same lens to CCOs. These organisations sit at the intersection of three conditions that create a serious accountability vacuum:

  1. They run monopolies or near-monopolies - no competitor can offer cheaper water, public transport, or port services.

  2. Their boards are appointed, not elected. Voters do not choose the directors, and the councillors who appoint them do not manage them day-to-day.

  3. Directors are almost impossible to remove when ratepayers are unhappy. CCOs continue unchanged no matter who wins council elections. The democratic feedback loop never closes.

No market discipline. No democratic discipline. Ratepayers pay regardless.

Fuel price hikes annoy us because they flow into the cost of everything. But fuel still operates in a competitive market: you can switch brands, go electric, take the bus, or drive less. Water has no such substitute. You cannot switch providers, install a cheaper pipe, or easily opt out. If fuel prices trouble you, water should give you nightmares - because the entity setting the price answers to no one you can vote out.

If "no taxation without representation" means anything in 2026, any body with the power to compel payment must answer to those who pay. That principle is the foundation of legitimate government.

On 1 July, IAWAI - Flowing Waters Ltd takes over water and wastewater services across Hamilton City and Waikato District. Owned 50:50 by the two councils and in partnership with Waikato-Tainui, its board is appointed by a nine-member Forum: three Hamilton representatives, three Waikato District representatives, and three Waikato-Tainui representatives - all with equal voting rights. Ratepayers will be legally required to buy from an entity whose governance includes voices no voter ever elected.

The Auditor-General warned in 2022 of "a serious diminution in accountability to the public for a critical service". The structural problem remains.

This week, Local Government Minister Simon Watts announced an amendment to the Local Government Act 2002 to restrict voting at council committee meetings to elected councillors only. "Councillors are directly accountable to voters for their decisions," he said. "That's not democratic, so we're fixing it." A welcome principle - but the reform applies only to council committees. The new water CCOs going live in three weeks sit outside the Local Government Act, governed instead under Local Water Done Well. The Forums that select their boards - the very arrangements that breach Watts' own principle - will keep their voting rights intact.

If it is not democratic at council level, it cannot be democratic at the water entity level either.

This is not just a water issue. The same governance model applies to Auckland Transport, port companies, and other major CCOs.

In Wellington, Tiaki Wai - also launching on 1 July - has confirmed a $645,000 CEO salary (more than the Prime Minister) and doubled director fees to $60,000, while households face average bills of $2,418 this year, potentially rising to $6,831 by 2036. Mayor Andrew Little called the salaries "generous". The Commerce Commission is now scrutinising pricing - proof that the only meaningful check is regulatory, not democratic.

The model is heading to Hawke's Bay. From 1 July 2027, water services for Hastings, Napier, and Central Hawke's Bay will transfer to a new joint CCO.

Two practical reforms would close the gap.

First, CCO directors should be either directly elected by ratepayers or appointed exclusively from sitting councillors. Either option creates a direct line of sight from voter to board. The former is more democratic; the latter is cheaper and integrates CCO governance into existing council accountability.

Second, directorships should be term-limited to the electoral cycle. A change in council should automatically refresh CCO boards. At present, voters can throw out a council only to discover the bodies actually running their water, transport, and ports remain untouched.

Critics will object that elected or councillor-appointed directors would be parochial and unqualified. Perhaps. But the current system produces unaccountable parochialism dressed up as professional governance. The ability to vote them out is worth more than the illusion of expertise from people who answer to no one.

We tolerate an unelected sovereign because he sets no rates, signs no major contracts, and cannot raise the price of your shower. He is a constitutional ornament. Our CCO directors are not.

New Zealanders take representation seriously – so why is there exception for organisations that can send us bills we cannot refuse?

No taxation without representation. It is not a slogan. It is the bargain.

Watts has now agreed with the principle - for councils. In three weeks, water entities operating on the very arrangements he has just rejected go live in Wellington and the Waikato. Hawke's Bay follows a year later. Either the democratic principle applies everywhere, or it applies nowhere.

The King, at least, had the decency to stay out of it.


Nick Stewart

(Ngāi Tahu, Ngāti Huirapa, Ngāti Māmoe,
Ngāti Waitaha)

Financial Adviser and CEO at Stewart Group

  • Stewart Group is a Hawke's Bay and Wellington based CEFEX & BCorp certified financial planning and advisory firm providing personal fiduciary services, Wealth Management, Risk Insurance & KiwiSaver scheme solutions.

  • The information provided, or any opinions expressed in this article, are of a general nature only and should not be construed or relied on as a recommendation to invest in a financial product or class of financial products. You should seek financial advice specific to your circumstances from a Financial Adviser before making any financial decisions. A disclosure statement can be obtained free of charge by calling 0800 878 961 or visit our website, www.stewartgroup.co.nz


SOURCES

  • Maori ward referendums (Oct 2025): RNZ; final national tally per Wikipedia (Keep 542,134 / Remove 467,923 / margin 74,211).

  • IAWAI - Flowing Waters Ltd (Hamilton/Waikato water CCO, operational 1 July 2026): Hamilton City Council governance page.

  • Local Water Done Well overview: Bell Gully briefing.

  • Auditor-General, "Submission on the Water Services Entities Bill" (8 August 2022): oag.parliament.nz.

  • Local Government Act amendment announcement (Hon Simon Watts, 2 June 2026): Stuff; press release reproduced at Mirage News, "Council Voting Limited To Elected Officials".

  • Tiaki Wai pay and pricing (April-May 2026): NZ Taxpayers' Union release; NZ Herald, "New Wellington water entity Tiaki Wai defends salary spend for top officials" (13 April 2026); NZ Herald, "Tiaki Wai opens books, warns of higher costs to households" (24 March 2026); RNZ, "Mounting confusion over new water bills looming for Wellington region residents" (22 May 2026).

  • Hawke's Bay joint water CCO (operational 1 July 2027): Napier City Council news release.

Budget 2026: A better story, if you believe the assumptions

Article #459

For decades I have written about the Budget from the outside. This year, I was fortunate enough to be there in person – in the lockup, with the Treasury’s forecasts and supplementary documents in front of me before the Minister rose to speak. There is value in having the source material itself, rather than seeing headlines that come after. What follows is my read.

The Budget Economic and Fiscal Update released on 28 May tells a more reassuring story than the Half Year Update did back in December.¹ Deficits narrow earlier. The cyclically adjusted OBEGALx, the operating-balance measure favoured by Finance Minister Nicola Willis as it strips ACC’s volatile revenue and expenses out of the historical OBEGAL, returns to surplus in 2028/29; a full year sooner than previously forecast.² Tax revenue holds up better than feared. And on the Treasury’s fiscal-balance measure, which tracks the actual cash impact of government on the economy, policy keeps supporting demand through 2026/27 before tightening from 2027/28 onwards.³

On the surface it is a better-than-expected set of numbers. As always, the trouble is what sits underneath them.

The forecasts assume real GDP growth lifts from 1.2% this year to a peak of 3.2% by 2028. This would be a sharp acceleration after three years of contraction or near-zero growth.⁴ They assume unemployment peaks at 5.5% and then drifts back down to 4.3%, and that net migration recovers towards its long-run average having run at barely a quarter of that recently. Each assumption is plausible on its own. The sticking point is that the recovery needs most of them to arrive together, and roughly on schedule.

Inflation is the assumption that should give readers the most pause. In these forecasts, it takes a less-than-linear, lurching path: CPI surges to 4.0% this year, driven in part by higher fuel prices flowing from offshore conflict, before the forecast has it dropping abruptly to 1.6% in 2027, then settling around 2%.⁵ That near-halving in twelve months is a heroic call. It looks more heroic still when you separate out domestic, non-tradeable inflation, the prices generated here at home, in services, rates and rents – which Stats NZ measured at 3.5% in the year to March, with electricity up 12.5% and council rates up 8.8%.⁵

Ask any local who has just opened a new rates letter, renewed an insurance policy, or braced for yet another ramp-up in winter power prices. The cost-of-living squeeze people are actually feeling is not the tidy headline figure the forecast leans on. And a great deal does rest on that figure, because inflation feeds wage expectations, interest costs and the tax take all at once. If domestic prices prove stickier than assumed, the path back to surplus gets harder.

The forecasts also assume the Government will deliver on ambitious savings tracks at Health New Zealand, Kāinga Ora and the Ministry of Social Development – all organisations that have run material operating deficits.⁶ Every line of the recovery requires for something to land more or less perfectly. The Treasury’s own statement of specific fiscal risks runs to dozens of substantial items; a catalogue of expensive surprises waiting to happen.⁶

Meanwhile, the wave of cost coming our way is neither theoretical nor distant. It is here now.

Defence capability needs roughly $6 billion in new funding over the next two Budgets just to deliver the existing plan. The Health Infrastructure Plan identifies more than $20 billion over the next decade. The school property pipeline signals a significant uplift. Treaty relativity payments and pay equity settlements remain live cross-portfolio risks.⁶

Nowhere is the pressure clearer New Zealand Superannuation. NZ Super payments are forecast to climb from $24.7 billion in 2025/26 to $31.2 billion by 2029/30, an average increase of about $1.6 billion every year. This is the single largest driver of core Crown expense growth, with roughly half of that uplift simply more people turning 65.⁹ Against that backdrop, the decision to recommence contributions to the Super Fund is genuinely welcome – but light on detail for what is, on any honest reading, the largest looming fiscal pressure of the next two decades.

That’s the sobering side. There is a more encouraging side too, and parts of it land particularly well for our Hawke’s Bay region.

The tax package is sensibly targeted rather than flashy. Lifting the Foreign Investment Fund de minimis threshold from $50,000 to $100,000 of shareholdings is a solid, practical move. Combined with allowing the revenue account method for unlisted shares held by any New Zealand resident, it removes a barrier to migration for skilled people and cuts compliance costs for ordinary investors – who should never have been tangled in rules built for complex international structures.⁷ The accompanying changes to charities and not-for-profit settings, including a $100,000 annual cap on individuals’ rebate claims, tidy up a system that had drifted from its purpose.⁷

But, not everything in the package is so easily defended. One such outlier is the Emerging Managers’ Programme, a scheme backing first-time and emerging fund managers who invest in startup companies, with the aim of helping those funds build capacity, scale and a track record.⁸ No, you’re not reading that wrong: the Crown is effectively backing unproven managers who are backing unproven companies, stacking emerging-manager risk on top of early-stage venture risk. The mind boggles slightly.

There is somewhat of a rationale behind it – New Zealand’s venture ecosystem is thin, exits like Xero and Rocket Lab show what is possible, and the next generation of managers has to come from somewhere. But it sits oddly in a Budget otherwise sold on discipline and rebuilding buffers, and it will be worth watching closely how the guardrails are drawn.

Closer to home, the Budget delivers tangible benefits to Hawke’s Bay. Cash-strapped, debt-laden councils such as Hastings stand to benefit from changes giving them a share of consents value, a scaling mechanism that better matches revenue to the growth that creates the work. Funds have been earmarked for design and enabling works at Hawke’s Bay Hospital, alongside the wider Regional Hospital Redevelopment Programme.⁶ There’s also a $400 million reserve fund for state highway resilience projects aimed at keeping critical routes open during severe weather – something Hawke’s Bay residents understand the importance of more than most. Cyclone Gabrielle is not yet three and a half years behind us, and the Treasury itself rates comparable events as reasonably possible, at least once every four years, within the forecast period.⁶

The bottom line? This is a Budget Update that asks New Zealanders to take a fair amount on faith: that growth returns on cue, that inflation halves to target while domestic prices still bite, that savings targets are met, and that the events outside the Government’s control stay kind to us. The genuine wins for investors, charities, regional councils, hospital patients and motorists on vulnerable routes, deserve acknowledgement.

The risks deserve to be taken just as seriously.

The Treasury has done its job. It has shown us the figures and, in the supplementary information, told us plainly what could go wrong. The question is whether the rest of us are reading both halves of the document, so there aren’t surprises down the road if certain elements don’t stick the landing.


Nick Stewart

(Ngāi Tahu, Ngāti Huirapa, Ngāti Māmoe,
Ngāti Waitaha)

Financial Adviser and CEO at Stewart Group

  • Stewart Group is a Hawke's Bay and Wellington based CEFEX & BCorp certified financial planning and advisory firm providing personal fiduciary services, Wealth Management, Risk Insurance & KiwiSaver scheme solutions.

  • The information provided, or any opinions expressed in this article, are of a general nature only and should not be construed or relied on as a recommendation to invest in a financial product or class of financial products. You should seek financial advice specific to your circumstances from a Financial Adviser before making any financial decisions. A disclosure statement can be obtained free of charge by calling 0800 878 961 or visit our website, www.stewartgroup.co.nz


REFERENCES

[1] The Treasury (2026). Half Year Economic and Fiscal Update 2025. Wellington: New Zealand Government, 16 December 2025.

[2] The Treasury (2026). Budget Economic and Fiscal Update 2026: Supplementary Information: Underlying Fiscal Performance (Cyclically-adjusted and Structural Balance Indicators), B.3, pp. 47–49. Wellington: New Zealand Government, 28 May 2026.

[3] The Treasury (2026). Budget Economic and Fiscal Update 2026: Supplementary Information: Fiscal Stance (Fiscal Balance and Total Fiscal Impulse Indicators), B.3, pp. 42–46.

[4] The Treasury (2026). Budget Economic and Fiscal Update 2026. Wellington: New Zealand Government, 28 May 2026; see also ‘Budget 2026: 10 things you need to know’, NZ Herald, 28 May 2026.

[5] The Treasury (2026). Budget Economic and Fiscal Update 2026: Supplementary Information: Detailed Economic Forecast Information, Table 2 (CPI) and Table 6 (Labour Market Indicators), B.3, pp. 33, 37; non-tradeable inflation of 3.5% from Stats NZ (2026), Consumers Price Index: March 2026 quarter, 21 April 2026.

[6] The Treasury (2026). Budget Economic and Fiscal Update 2026: Supplementary Information: Unchanged Specific Fiscal Risks and Contingent Liabilities, B.3, pp. 6–30.

[7] The Treasury (2026). Budget Economic and Fiscal Update 2026 — Supplementary Information: Tax Policy Changes, B.3, pp. 39–40; and Inland Revenue / The Treasury (2026), 2026 Tax Expenditure Statement, 28 May 2026.

[8] The Treasury (2026). Summary of Initiatives in Budget 2026, B.19, p. 9: Emerging Managers’ Programme. Wellington: New Zealand Government, 28 May 2026.

[9] The Treasury (2026). Budget Economic and Fiscal Update 2026, Fiscal Outlook — drivers of New Zealand Superannuation expense growth. Wellington: New Zealand Government, 28 May 2026.

Death and Taxes

Article #458

This Thursday, Nicola Willis will deliver Budget 2026. The headlines will be familiar: tight control of spending, focus on health, education, defence and law and order, a return to surplus.[1] To her credit, the Finance Minister has shown discipline.

On Tuesday, in her pre-Budget speech to Business North Harbour, she announced 8,700 public service job cuts over the next three years, $2.4 billion in savings, the merger of agencies, and AI as “a basic expectation” across government systems.[2] The public service had grown from roughly 48,000 in 2017 to over 63,000 by the end of 2024, a 33 percent expansion in six years against largely flat productivity growth. Trimming it back toward 1 percent of population is overdue.

The harder question is timing. The coalition has been in office for two and a half years. The electoral mandate was fresh in late 2023. Decisions of this magnitude, with this kind of political cost, are easier early in a term and almost impossible to deliver in election year without the optics looking opportunistic. The reforms should have been made then.

That delay matters because the bond market is a fickle lover when a country is carrying heavy debt and producing little productivity growth. Fitch has placed New Zealand’s AA+ rating on negative outlook, citing rising challenges in reducing debt after years of delayed fiscal consolidation; debt to GDP is projected to reach 56 percent by 2027.[3] The 10-year government bond yield is sitting near 4.7 percent. Every basis point on that yield translates into real money in interest costs. Markets are watching, and they are no longer giving New Zealand the benefit of the doubt.

This is the fiscal context in which the campaign begins.

Budget Day on the 28th is not really the main event. It is the starting gun for the election campaign that ends on 7 November. And the backdrop against which that campaign will be fought is grim.

The NZX 50 touched fresh lows this week. The Gross Index, which includes reinvested dividends, has delivered a total return of around 3 percent over the past five years.[4] That is less than 1 percent per year in nominal terms. Strip out dividends, and the price-only index is in negative territory. Once you factor in cumulative inflation of around 20 percent, New Zealand investors have gone backwards by close to 17 percent in real purchasing power. No other major Western bourse can claim that distinction. The S&P 500 has roughly doubled. The ASX 200 is up around a third. The FTSE, long the laggard of major markets, has still delivered around 30 percent. Even the Nikkei, dormant for two decades, has delivered roughly 70 percent.

This matters because when the stock market is not creating wealth, politicians look for ways to redistribute existing wealth. That is the genuine political logic of the moment, and it is amplified by the mechanics of MMP. Labour cannot govern alone. To form a government, it will need the Greens and almost certainly Te Pāti Māori. Whatever Labour campaigns on, the coalition partners will demand more.

Labour has confirmed it will campaign on a capital gains tax targeted at residential and commercial property, with revenue ringfenced for free GP visits.[5] The Greens have gone further, proposing a 2.5 percent annual wealth tax on net assets above $2 million, and a 33 percent inheritance tax on lifetime gifts and estates above a $1 million threshold.[6] Te Pāti Māori has signalled wealth taxes as a coalition bottom line.[7] Fitch has reportedly been briefed on tax measures beyond what Labour has publicly disclosed.[8]

The Greens’ inheritance tax proposal is the one to pay closest attention to. It is, in everything but name, the return of estate duty. And it is worth remembering, on the eve of a Budget that opens an election year, why New Zealand abandoned that tax in 1992.

Estate duty was sold as a tool of equity. In practice, it became a destroyer of family legacies. By the early 1970s, rates had climbed as high as 40 percent, with thresholds catching far more than just the wealthy.[9] For families whose wealth was tied up in illiquid assets, the death of a patriarch or matriarch triggered financial catastrophe.

The Hawke’s Bay orcharding sector provides stark examples. Local orchardists who had spent decades developing pipfruit operations found their estates assessed at development values rather than agricultural income values. Families faced duty bills exceeding several years of profit. The choice was bleak: sell blocks to developers, or take on crippling loans.[10] Many spent thirty years or more servicing that debt, an entire generation lost to a single tax assessment. A block of land that had taken a grandfather forty years to develop into productive orchard could be lost to an unexpected death and an Inland Revenue assessment within eighteen months.

The Waikato dairy sector tells the same story. Multi-generational farms were forced to sell down herds and land to meet duty bills. The remaining operations often lacked the scale needed to remain viable, and some families saw their children leave farming altogether.[11] It was not incompetence that ended these legacies. It was a tax code that demanded immediate liquidity from operations that simply do not generate it.

Rural service businesses, the stock and station agents, transport firms, processing contractors, faced the same pressure. Many took on outside investors to meet duty bills, and those investors eventually engineered buyouts. The consolidation of New Zealand’s agricultural service sector during the 1980s owed much to estate duty’s destabilising effect.[12]

Defenders argued at the time, and will argue again, that proper planning could avoid these outcomes. Two things are worth saying about that. First, the planning itself was a deadweight cost. Families spent thousands on lawyers and accountants navigating frequently changing rules rather than reinvesting in their enterprises.[13] Second, deaths do not arrive on schedule.

What does prudence look like in practice? It looks like reviewing trust structures that may have been set up two decades ago under different rules. It looks like understanding which assets sit where, who owns what, and what the liquidity profile of an estate actually is on any given day. It looks like considering whether life insurance has a role to play in funding potential tax liabilities. It looks like beginning the conversations between generations that families instinctively defer.

The lesson from estate duty is not that all tax is bad. It is that taxes on illiquid family assets transfer productive wealth from those who built it to whoever has the ready cash to buy at distress prices. That is not redistribution. It is destruction. And it is being proposed at a moment when fewer families have the financial cushion to weather it, against a stock market that has produced no real wealth for half a decade.

Thursday’s Budget will not settle this debate. It opens it. Families with farm, orchard, or business assets ought to be reviewing their structures now, seeking wise counsel from advisers who understand both the tax architecture and the fiduciary weight of decisions made under pressure. None of this argues for selling out of New Zealand equities at the lows: capitulation at the bottom is the parallel mistake, the same wealth destruction by another route. The answer is diversification and counsel, not retreat. The families who recovered from estate duty were almost always those who took advice early. The ones who lost everything were those who waited until the tax was already in force.

History rhymes. It does not, thankfully, repeat. But only if we are paying attention.


Nick Stewart

(Ngāi Tahu, Ngāti Huirapa, Ngāti Māmoe,
Ngāti Waitaha)

Financial Adviser and CEO at Stewart Group

  • Stewart Group is a Hawke's Bay and Wellington based CEFEX & BCorp certified financial planning and advisory firm providing personal fiduciary services, Wealth Management, Risk Insurance & KiwiSaver scheme solutions.

  • The information provided, or any opinions expressed in this article, are of a general nature only and should not be construed or relied on as a recommendation to invest in a financial product or class of financial products. You should seek financial advice specific to your circumstances from a Financial Adviser before making any financial decisions. A disclosure statement can be obtained free of charge by calling 0800 878 961 or visit our website, www.stewartgroup.co.nz


REFERENCES

[1] The Treasury, Budget 2026, 28 May 2026, treasury.govt.nz/publications/budgets/budget-2026

[2] NZ Herald, Nicola Willis’ public service cuts to save $2.4b, 8700 jobs to go, 19 May 2026; 1News, Thousands of public service jobs to go, major Govt shake-up announced, 19 May 2026

[3] Fitch Ratings, New Zealand AA+ outlook revised to negative, March 2026; Trading Economics, New Zealand 10-Year Government Bond Yield

[4] S&P/NZX 50 Gross Index, 5-year return data to 20 May 2026, NZX and Yahoo Finance

[5] NZ Herald, Labour’s capital gains tax: Chris Hipkins celebrates ‘progressive’ policy, 28 October 2025

[6] Become Wealth, Wealth Tax NZ: What It Means and Who Would Pay, April 2026; Green Party Alternative Budget 2025

[7] RNZ, Te Pāti Māori proposes suite of changes in new tax policies

[8] Scoop News, Fitch Report Exposes Labour’s Secret Tax Agenda, 29 April 2026

[9] Inland Revenue Department, Annual Report 1975 (Wellington: Government Printer, 1976), 23-25

[10] P.J. Skellerup, “Estate Duty and the New Zealand Horticultural Sector,” NZ Journal of Agricultural Economics 3, no. 2 (1979): 45-52

[11] Ministry of Agriculture and Fisheries, Agricultural Statistics 1980 (Wellington: Government Printer, 1981), 67-89

[12] R.M. Sandrey and S.R. Reynolds, “Structural Change in New Zealand Agriculture 1972-1987,” Review of Marketing and Agricultural Economics 58, no. 1 (1990): 15-28

[13] NZ Law Society, Submission on Estate and Gift Duties Amendment Bill (Wellington: NZLS, 1983), 8-12

The GDP Trap: Why Technology Sceptics Keep Getting It Wrong

Article #457 - A Canny View on Capital, Productivity and the AI Moment

I was in Wellington last month, watching my son play rugby. Between the lineouts, the bagpipes, and the cheering crowds, I found myself deep in conversation with some of the opposing team's parents (as you do). One of them, it turned out, reads this column. She'd been listening to a podcast during the week and wanted to pick my brain on something that had been bothering her: the idea that technology, the internet, and now AI doesn't move the needle on GDP. Was I convinced? Did I think AI would go the same way?

I told her I'd think about it properly and write it up. So here we are.

The argument is that the internet failed to shift GDP. Productivity growth stayed stubbornly flat through the digital revolution, and AI will likely disappoint in the same way.

Tidy. Plausible. But - wrong.

Start with the measure itself. GDP is the bluntest instrument in the economist's toolkit. It counts what gets transacted, not what gets created. It captures the volume of economic activity, but not the quality of the decisions that drive it. It has no mechanism for measuring time saved, stress reduced, options expanded or freedom gained. Judging technological progress through GDP alone guarantees you miss the point entirely.

Economist Robert Solow noticed this as far back as 1987, when he observed that the computer age appeared everywhere except in the productivity statistics – a phenomenon that became known as the Solow Productivity Paradox.¹ History eventually proved him right, just on a longer lag than the critics expected. Technology hadn’t failed. GDP was simply a poor timekeeper.

Technology is an enabler, not a product

Take the motor vehicle. The combustion engine restructured how people moved, how goods flowed, and how entire societies organised themselves. The GDP figures didn't move immediately in response to this technological feat. Infrastructure had to be built. Habits had to change. Supply chains had to be reimagined, and entirely new industries – fuel, insurance, hospitality, suburban housing – had to emerge. But once those conditions were in place, the uplift was extraordinary. We produced and shipped volumes of goods that would have been incomprehensible to the previous generation. The technology compressed time, distance and cost simultaneously, and returned something more valuable than efficiency: freedom. Freedom of movement, of choice, of attention. We enjoy freedoms our grandparents couldn't have imagined, and GDP only partially accounts for why.² The full value of what technology returns to human life has always been larger than what the national accounts can see.

The internet followed the same pattern: in its infancy, productivity statistics disappointed. Critics pointed to flat lines - exactly the lines we hear cited about AI today. Sceptics declared the revolution oversold. Then, suddenly, everything changed.

Amazon didn't just create a retail channel. It rewrote the rules of commerce, warehousing, logistics and consumer expectation. Google didn't just organise information, it fundamentally altered how knowledge was accessed and shared. The internet became the incubation platform for industries that couldn't previously exist: the gig economy, streaming, fintech, e-commerce, social media, and the vast ecosystem of software-as-a-service that now underpins nearly every business on the planet.³

GDP followed. It always does, eventually - the error is expecting it to lead.

Which brings us to AI, and the real question…

Transformation, or novelty?

The evidence points firmly to the former. AI is not an application. It is infrastructure. Just as the internet built a platform beneath entire industries, AI is now embedding itself beneath every workflow, every decision, every process across every sector simultaneously. Its speed of adoption is faster than any previous general-purpose technology, reaching 100 million users in months rather than the decades it took electricity or the telephone to achieve comparable penetration. The McKinsey Global Institute estimates AI could add between $13 and $22 trillion to the global economy annually by 2030, with generative AI alone contributing $2.6 to $4.4 trillion across industries each year.⁴

Businesses dismissing it as a "nice to have" remind me of Spencer Johnson's parable, “Who Moved My Cheese?”⁵ It describes how those who refuse to adapt are left behind not through any single dramatic moment, but through the slow, steady movement of the world around them. The cheese has moved. It is moving right now. Yet, some are still debating whether it will move at all.

For those of us who allocate capital on behalf of clients, this is not an abstract debate. It is a practical and urgent one, and it cuts to the heart of how we should think about investment discipline in a period of structural change.

History will likely repeat… eventually.

The data clearly tells us that active managers – those who believe they can outthink the market, pick winners and time the turns – have a consistently poor record of doing so. The SPIVA Scorecard, published by S&P Dow Jones Indices, shows that over a 15-year period, nearly 90% of active fund managers underperform their benchmark index.⁶

Across global markets, including Australia and New Zealand, the findings are consistent. The crystal ball is no clearer in professional hands than in the layman's. The complexity of markets, the speed of information and the weight of costs conspire to make consistent outperformance not merely difficult but statistically improbable.

A robust, evidence-based framework protects clients from the most persistent and costly mistakes in investing: reacting to noise, chasing narratives, and confusing confidence with competence.

Understanding AI and its long-term implications is not about picking technology stocks or timing a wave – that’s where you can get into trouble, à la NFTs and other failed hype stocks.

It is instead about recognising when the world is changing structurally, and ensuring that clients are positioned to participate in the full arc of that change over time – through diversified, low-cost and disciplined portfolios. The opportunity is not in predicting which companies win, but in making sure clients are in the game when the GDP finally catches up – because eventually, it will.

The woman I spoke with in Wellington already sensed this. She wasn't asking whether AI was real. She was asking whether the people managing her money understood it well enough to make sound decisions on her behalf – which is exactly the right question to be asking.

Technology enables. Capital follows. The data has never told us otherwise. The sceptics may be right on timing, but history suggests they are wrong on direction.


Nick Stewart

(Ngāi Tahu, Ngāti Huirapa, Ngāti Māmoe,
Ngāti Waitaha)

Financial Adviser and CEO at Stewart Group

  • Stewart Group is a Hawke's Bay and Wellington based CEFEX & BCorp certified financial planning and advisory firm providing personal fiduciary services, Wealth Management, Risk Insurance & KiwiSaver scheme solutions.

  • The information provided, or any opinions expressed in this article, are of a general nature only and should not be construed or relied on as a recommendation to invest in a financial product or class of financial products. You should seek financial advice specific to your circumstances from a Financial Adviser before making any financial decisions. A disclosure statement can be obtained free of charge by calling 0800 878 961 or visit our website, www.stewartgroup.co.nz


REFERENCES

  1. Solow, R. (1987). We'd better watch out. New York Times Book Review. The observation, "you can see the computer age everywhere but in the productivity statistics", gave rise to what economists termed the Solow Productivity Paradox.

  2. Crafts, N. (2004). Steam as a General Purpose Technology: A Growth Accounting Perspective. Economic Journal. Documents the long lag between transformative technology adoption and measurable economic uplift, a pattern repeated across industrial revolutions.

  3. Brynjolfsson, E. & McAfee, A. (2014). The Second Machine Age. W.W. Norton & Company. Argues that digital technology's economic impact was systematically underestimated because GDP fails to capture consumer surplus and free digital goods.

  4. McKinsey Global Institute (2023). The Economic Potential of Generative AI. McKinsey & Company. Estimates generative AI could add $2.6 to $4.4 trillion annually across industries, with broader AI contributing $13–$22 trillion by 2030.

  5. Johnson, S. (1998). Who Moved the Cheese? G.P. Putnam's Sons. A business parable on adaptability and the cost of resisting inevitable change.

  6. S&P Dow Jones Indices (2026). SPIVA U.S. Scorecard, Year-End 2025. Over a 15-year horizon, 90% of large-cap active managers underperformed the S&P 500. Consistent findings are reported across global markets including Australia and New Zealand.

Air New Zealand: The Worst of Both Worlds

Article #452

Fifty percent government-owned, operating like a budget carrier, charging premium prices, Air New Zealand occupies the most uncomfortable position in aviation. It’s neither fish nor fowl: not quite private, not quite public, delivering neither the efficiency of true competition nor the service standards of genuine public ownership.¹

Welcome to the warm embrace of collectivism. It’s getting warmer, and not in a good way.

The Flightless National Carrier

The symbolism writes itself. Air New Zealand, like the kiwi, has become a flightless bird, grounded by contradictions, unable to soar because it refuses to commit. Government ownership was supposed to protect the national interest. Instead, it has created an airline that enjoys privileges without facing consequences: government contracts, preferential treatment, implicit bailout guarantees, all without the full discipline of the market or the scrutiny of complete public accountability.¹

When things go wrong, taxpayers are on the hook. When things go right, shareholders collect the dividends.

New Zealanders know this intimately: the airline received NZ$2.3 billion in Crown support during COVID-19.² The structural trap was set long before the current crisis.

The World is on Fire. Air NZ has a Newsletter.

On 8 April 2026, CEO Nikhil Ravishankar sent customers a carefully worded email. “Kia ora Nick,” it began warmly. He wanted to update customers on jet fuel prices. Fuel had surged from around US$85–90 a barrel to above US$200, effectively doubling Air New Zealand’s daily fuel bill from NZ$4 million to NZ$8.5 million. Schedule cuts for May and June were confirmed. More were promised to be “deliberate and carefully considered.”³

Warm. Reassuring. Human, even, which is ironic, given what you encounter when you actually try to contact the airline.

This crisis is not Air New Zealand’s alone. Iran’s effective closure of the Strait of Hormuz, through which over 20% of global seaborne jet fuel normally flows, has sent shockwaves through the entire industry.⁴ More than 14,000 flights globally have been cancelled since late February 2026.⁵

Ryanair’s Michael O’Leary has predicted summer cancellations of 5–10% across Europe.⁶ United Airlines’ CEO Scott Kirby has warned his carrier’s fuel bill could double to US$20 billion.⁷ Lufthansa’s CEO has assigned teams to contingency planning.⁸ SAS has cancelled over 1,000 flights in April alone.⁹ Energy analysts at Kpler warn that even if the Strait reopened tomorrow, prices would not fall quickly: production has been taken offline, and the market hangover could last well into 2027.¹⁰

The difference between Air New Zealand and those carriers is structural. Most are pure private enterprises; they face consequences. Air New Zealand faces a shareholder with a printing press.

The Numbers are Brutal

Forsyth Barr’s March 2026 report is stark: Air New Zealand could book a net loss of $226 million in FY2026, and $148 million in FY2027 if fuel costs remain elevated.¹¹ Macquarie analysts warn that capacity cuts will fall primarily on domestic and Tasman routes.¹² The share price has reflected the outlook, trading near its 52-week low at $0.48, down sharply from $0.64.¹³

The airline has already trimmed near-term capacity by 5%, with more reductions almost certain.

Watch for the Capital Raise

Here is what the CEO’s warm email does not say: if losses of this magnitude materialise over two financial years, Air New Zealand will need to raise capital. When it does, the New Zealand government, as 50.1% shareholder, faces an unavoidable choice. Participate, and write another substantial cheque from the public purse to protect its stake. Or decline, dilute, and begin the slow retreat from an ownership position it has held for decades.

Either outcome implicates taxpayers. Either outcome exposes the central absurdity of the current arrangement. Budget 2026… hold your breath.

Chatbots and Contempt

Try contacting Air New Zealand’s customer service, and you will discover the true face of modern collectivist enterprise: woeful service, declining standards, and a corporate structure that treats human interaction as an inconvenience to be automated away.

You are more likely to engage with a chatbot than a human, and the human, when you eventually find one, operates like a chatbot anyway—scripted, bounded, unable to resolve anything of substance. The airline’s answer to its service failures is not better people or better training, but better systems for apologising for the absence of both.

The Hospital Pass

That’s what recommending Air New Zealand has become, and nowhere is the gap between price and product more vivid than in business class, where Air New Zealand’s structural contradictions are most expensive to observe firsthand.

The airline’s new Business Premier cabin, rolling out across its Boeing 787 fleet through 2026, retains a herringbone configuration. Passengers sit angled toward the aisle rather than toward the window, the opposite of the reverse herringbone suites now standard on Qatar Airways, Singapore Airlines and Cathay Pacific.¹⁴ Standard Business Premier seats come equipped with a sliding privacy screen. Not a door: a screen.

A door costs extra. Specifically, NZ$820 (approximately US$487) extra on long-haul.¹⁵ There are four of them on the entire retrofitted aircraft.¹⁶ Aviation analysts reviewing the product have described the standard offering as “fairly underwhelming” compared to what the competition offers.¹⁷

You’d book Qantas if you could, but with Emirates disrupted by Iranian airspace closures, rerouting flights away from Gulf hubs, alternatives from New Zealand are thinner than they have been in years.¹⁸

Choose

New Zealand deserves better than this muddled middle ground. Our national carrier should be either a source of genuine pride (fully public, properly accountable, serving citizens) or a true competitor, privately owned and driven to excel.

Full public ownership means genuine accountability: real service obligations, routes chosen for public benefit, consequences for failure. Full privatisation means real competition, no bailouts, market discipline for a product that currently charges a premium for the privilege of facing a stranger across a narrow aisle.

What we have instead is the comfortable middle ground that serves nobody.

Make a choice. Commit to something. Because right now, our national carrier charges like Singapore Airlines, seats you in a layout from 2005, asks NZ$820 extra for a door, deploys a chatbot when you complain, and may shortly be asking the government for more money.

That’s not the warm embrace of collectivism. That’s the slow squeeze.


Nick Stewart

(Ngāi Tahu, Ngāti Huirapa, Ngāti Māmoe,
Ngāti Waitaha)

Financial Adviser and CEO at Stewart Group

  • Stewart Group is a Hawke's Bay and Wellington based CEFEX & BCorp certified financial planning and advisory firm providing personal fiduciary services, Wealth Management, Risk Insurance & KiwiSaver scheme solutions.

  • The information provided, or any opinions expressed in this article, are of a general nature only and should not be construed or relied on as a recommendation to invest in a financial product or class of financial products. You should seek financial advice specific to your circumstances from a Financial Adviser before making any financial decisions. A disclosure statement can be obtained free of charge by calling 0800 878 961 or visit our website, www.stewartgroup.co.nz

Canny View: Into the Bush — and Back, Rewarded 

Article #451

The crack of a rifle echoes through the ranges. Deer season is open, and thousands of New Zealand hunters are pulling on their boots, loading up their packs, and heading into the hills with purpose. The roar is in full swing, and the pursuit of a good stag and a well-stocked freezer is very much alive. 

As I watch the preparations unfold each year, I can't help but see unmistakable parallels between heading into the bush and heading into the markets. Both reward the well-prepared investor. Both punish the cavalier. In both cases, coming home well and coming home rewarded start long before you take your first step. 

Know the terrain before you go in 

No serious hunter heads into unfamiliar bush without doing their homework first. They study the topography, understand the animal patterns, check the weather forecast, and know their exit routes. They talk to people who have hunted that country before. They don't assume that experience from one range translates perfectly to another. 

The investment landscape demands the same meticulous care. Before committing capital, the prepared investor takes time to understand the environment they're entering: market conditions, their own risk tolerance, time horizon, and the nature of the assets they're holding. Again, a fund or asset class that performed brilliantly in one market cycle may behave very differently in the next. 

Winging it in either arena tends to end badly, and usually at a financial cost to the unwary. 

Make your intentions known 

Every responsible hunter tells someone where they're going, when they expect to be back, and the route they plan to take. More than mere courtesy, this is protocol that keeps people safe when conditions change unexpectedly. Search and rescue teams will tell you that the single most useful thing a hunter can do before heading out is leave a detailed intentions form with someone they trust. 

In financial planning, this translates to working with a trusted fiduciary adviser who holds the full picture of your goals, your situation, and your plan. They're the person who knows where you're headed, what you're working towards, and can raise the alarm or offer a steadying, experienced hand if the conditions shift unexpectedly. A financial plan that lives only in your head is about as useful as intentions you forgot to leave behind before heading into the ranges. 

Safety first: Treat every firearm as loaded 

The golden rule of firearm safety is to treat every weapon as if it's loaded, every time, without exception. No shortcuts, no assumptions, no matter how familiar the environment or how experienced you are. The moment you stop following the rules is the moment accidents happen. 

In investing, the equivalent is always respecting risk, even when conditions look calm, and the market appears benign. It's easy to become cavalier about risk after a long bull run. Portfolios go up, confidence grows, and caution starts to feel unnecessary. But the investors who come unstuck are rarely those who panicked in a downturn; more often, they're the ones who stopped taking risk seriously when times were good and had over-exposed themselves before the conditions changed. Complacency is the safety left on when you're absolutely sure you don't need it, and this oversight will catch up with you eventually. 

Don't pull the trigger prematurely 

A seasoned hunter knows that a poor shot, taken in haste, without a clear line of sight, or before the animal is properly settled, can wound rather than harvest, and cost you the opportunity altogether. Patience is not a waste of time, nor mere passivity. It is the active, disciplined decision to wait until conditions are right. 

The same applies to investment decisions made in the heat of the moment. Selling out of a portfolio when markets fall sharply can feel decisive, and even prudent, at the time. But it often locks in paper losses and leaves you sitting on the sidelines in cash when the recovery comes. And recoveries, historically, tend to come faster and more forcefully than most people expect. 

The discipline to hold your position, wait for the right conditions, and resist the urge to act simply because the uncertainty is uncomfortable is what separates a skilled, long-term investor from a reactive one. 

Go prepared and stay prepared 

The experienced hunter carries more than a rifle. They bring a first aid kit, emergency shelter, a personal locator beacon, and enough food and water to last longer than expected. They aim for the best outcome, while being genuinely prepared for the worst.

A well-constructed investment portfolio works the same way.  

Diversification is your emergency kit. It won't prevent all downturns or shield you from every storm, but it ensures no single bad outcome takes you out entirely. Spreading your exposure across asset classes, geographies, and sectors means that when one area of the market is under pressure, others may be holding firm or even gaining ground. Regular reviews with your adviser are the equivalent of checking your gear before each outing; it's essential maintenance that most people wish they'd undertaken sooner when something eventually goes wrong. 

The reward is in the preparation 

Seasoned hunters come home with something to show for their efforts more often than not, and it's not luck. It's methodical preparation, sound judgment, deep respect for the environment, and the discipline to follow the rules—even when no one is watching and it would be easy to cut corners. 

The same is true of investing. The clients who tend to come home well-rewarded are rarely those who chased the latest hot opportunity or abandoned their carefully built plan at the first sign of difficulty. They're the ones who went in prepared, stayed their course through the inevitable rough patches, kept reviewing and adjusting with their adviser, and trusted a disciplined, evidence-based process over the long run. 

The bush doesn't care how confident you are. Neither do the markets. But go in right, with a clear plan, the right gear, a trusted guide, and the discipline to follow through when it counts, and both have something well worth taking home. 

And if the stag proves elusive this Easter, there's always the egg hunt: a somewhat safer pursuit, with arguably better odds of coming home rewarded. 


Nick Stewart

(Ngāi Tahu, Ngāti Huirapa, Ngāti Māmoe,
Ngāti Waitaha)

Financial Adviser and CEO at Stewart Group

  • Stewart Group is a Hawke's Bay and Wellington based CEFEX & BCorp certified financial planning and advisory firm providing personal fiduciary services, Wealth Management, Risk Insurance & KiwiSaver scheme solutions.

  • The information provided, or any opinions expressed in this article, are of a general nature only and should not be construed or relied on as a recommendation to invest in a financial product or class of financial products. You should seek financial advice specific to your circumstances from a Financial Adviser before making any financial decisions. A disclosure statement can be obtained free of charge by calling 0800 878 961 or visit our website, www.stewartgroup.co.nz

The Centurion’s Warning: Superannuation at 65—comforting politics, hard maths

Article #450

Nine years ago, I wrote about Roman Centurions. The New Zealand Economics Forum last month proved I wasn’t being dramatic enough.

When I wrote my very first Canny View in September 2017, I told the story of Roman Emperor Augustus and his military pension scheme, the Aerarium militare. Augustus faced a problem that will sound familiar: Romans were living longer, the pension fund was catastrophically underfunded, and someone had to pay for it.

His solutions were creative, if not entirely honest. Keep raising taxes. Extend the military service requirements, again and again. And when the pension rolls got too heavy? Launch another campaign! Rome always found another frontier war conveniently thinned the numbers — the Germans, the Dacians, the Parthians. It was just fiscal procrastination dressed up as military glory.

I wrote then: what is happening today is no different to those Roman times. At the end of the day, someone has to pay for it.¹

The Road to Rome’s Problems

The Aerarium militare is one of history’s most instructive fiscal cautionary tales. Augustus established it in 6 AD, seeding it with 170 million sesterces of his own money — a sum so large he had to make it a personal gift to avoid a Senate revolt over new taxes. When that proved insufficient, he pushed through a 5% inheritance tax and a 1% sales tax on goods sold at auction to keep the fund solvent. When Tiberius later tried to abolish the sales tax, his generals warned him that there was no other way to pay veterans. So, the tax stayed.

Each time the fund came under pressure, the response was the same: extend the service requirement. Augustus raised it from 16 years to 20, then up to 25. Soldiers who had signed up expecting to retire at 16 years found the goalposts moved, repeatedly, for fiscal reasons. Sound familiar?

Some historians trace a significant part of Rome’s eventual decline to the Senate later cutting pension payments altogether. With less incentive to serve, Roman citizens stopped enlisting. The ranks filled with barbarian mercenaries. Cohesion and discipline collapsed. The pension problem eventually helped unravel the army that held the Empire together.

New Zealand introduced its own old-age pension in 1898 — one of the first countries in the world to do so, under Richard Seddon’s Liberal government. It would be received at age 65, when male life expectancy was just 56. Like the Aerarium, it was never designed to be paid to most people. It was a safety net for the few who beat the odds. The pension that most New Zealanders now expect to receive for 20-plus years of retirement was conceived for people who, statistically, were unlikely to reach it at all.

Shifting Demographics Add Up to a Problem

Back in 2017, when I wrote that first article, over 15% of New Zealand’s population was aged 65 or older. Today, we’re past 16% and heading towards 20–21% within the next decade.⁵ We’ve gone from around 750,000 receiving NZ Super then, to over 912,000 today.⁶ Crucially, the working-age population supporting them is shrinking proportionally.

It’s not a sudden crisis of compassion, but rather a mathematical problem. The ratio of workers to retirees is deteriorating. Empires fall not from external threats but from internal fiscal contradictions — and we are living that reality now.

What’s Changed Since 2017?

In 2017, Bill English had just opened the door to raising the retirement age to 67 from 2037. Jacinda Ardern promptly pledged to repeal it and declared she’d resign before raising the retirement age. Labour won, the policy was scrapped, and the age stayed at 65. It hasn’t shifted since.

Movement comes only at the margins. Residence requirements for NZ Super are increasing from 10 to 20 years, phased through to 2042.⁷ Superannuation will consume 18.6% of tax revenue by 2029, up from 16.6% in 2023.³ But the fundamental policy lever — the eligibility age — remains politically untouchable. Augustus would understand completely.

What Treasury Said in Hamilton

At February’s New Zealand Economics Forum in Hamilton, Treasury Secretary Iain Rennie warned that ageing is already materially lifting expenditure and will continue to do so throughout the next decade, outpacing revenue growth. Without policy changes, New Zealand’s debt trajectory will become unsustainable.²

The number of people receiving superannuation will grow from 928,000 today to over 1,084,000 by 2029/30. That’s roughly the entire population of Tauranga added to the pension rolls in just under five years, costing a cool $7.7 billion more per year – equivalent to 22% of all projected tax revenue growth over that period.² Rennie was clear this isn’t a problem for future governments alone: “They are part of the chill headwinds confronting the government now.”²

Treasury’s longer-term projections show that without policy changes, government debt could reach unsustainable levels by the 2060s. This would be driven primarily by superannuation and healthcare costs for our ageing population.⁴ Every year of inaction makes the eventual adjustments more severe. That’s Treasury’s own modelling, not an opinion.

The Age Question Nobody Wants to Answer

At the same forum, a panel of economists and former politicians concluded that New Zealand can’t afford superannuation at 65… or even 67. Some suggested eligibility may need to rise as high as 72 or 73 to be viable long-term.²

Back to our Roman friends: Augustus didn’t want to cut centurion pensions either, as it was politically impossible. Instead, he extended service requirements, raised taxes, and launched another Parthian campaign. Each short-term fix made the structural problem worse. Eventually, the promises became mathematically impossible to honour, and the system failed.

We are not Augustus. We have better data, better institutions, and better options. What we seem to lack is the political will to use them.

What Actually Needs to Happen

Raising the age alone won’t fix this. The Forum panel agreed on that much.²

The deeper issue is savings and productivity. There is no credible path to lifting New Zealand’s productivity without matching Australia’s savings rate.² That means taking KiwiSaver seriously: Not as a nice-to-have, but as the foundation of our retirement system.

With 3.4 million New Zealanders enrolled — 90% of the workforce — KiwiSaver has been a genuine success. But 1.6 million members were making no contributions as of March 2025, either out of the workforce or on contribution holidays.⁴ It’s a structural gap we keep patching rather than fixing.

Compulsory contributions, properly locked in until retirement, would be a meaningful start. Paired with a gradual, signalled increase in eligibility age — giving people decades to plan — and we begin to look less like Augustus clutching at straws, and more like a country with a plan.

If you’re under 50, don’t rely solely on NZ Super. Your KiwiSaver balance isn’t a supplement anymore. It’s becoming the primary pillar of your retirement income – treat it accordingly.

The 450th Edition Lesson

In my first article, I concluded that failing to act would be irresponsible and place an extremely unfair burden on younger generations.¹ Nine years later, that’s exactly what we’ve done.

New Zealand is in a stronger position than most comparable countries. But public debt is at its highest point in 30 years, and the cost curve is steepening. The window for gradual, manageable change is narrowing.

The Romans had options. They could have reformed early, adjusted gradually, and built a sustainable system. Instead, they extended, delayed, promised — until the promises became impossible to honour and the system helped collapse the army that held everything together.

We still have choices; they didn’t. But as Treasury made clear last month, that won’t be true forever. And conversation without action is just more Parthian campaigning.

The Centurions learnt too late that empires don’t honour promises they can’t afford. We can avoid that mistake. But only if we start now.


Nick Stewart

(Ngāi Tahu, Ngāti Huirapa, Ngāti Māmoe,
Ngāti Waitaha)

Financial Adviser and CEO at Stewart Group

  • Stewart Group is a Hawke's Bay and Wellington based CEFEX & BCorp certified financial planning and advisory firm providing personal fiduciary services, Wealth Management, Risk Insurance & KiwiSaver scheme solutions.

  • The information provided, or any opinions expressed in this article, are of a general nature only and should not be construed or relied on as a recommendation to invest in a financial product or class of financial products. You should seek financial advice specific to your circumstances from a Financial Adviser before making any financial decisions. A disclosure statement can be obtained free of charge by calling 0800 878 961 or visit our website, www.stewartgroup.co.nz


References

¹ Stewart, N. (2017, September 16). Like Romans, fall on our sword and raise retirement age. Stewart Group. https://www.stewartgroup.co.nz/we-love-to-write/2017/9/16/like-romans-fall-on-our-sword-and-raise-retirement-age

² New Zealand Economics Forum 2026 (February 2026). Treasury presentations on fiscal sustainability and superannuation costs.

³ New Zealand Treasury. (2025). Budget Economic and Fiscal Update 2025. https://www.treasury.govt.nz/publications/efu/budget-economic-and-fiscal-update-2025

⁴ New Zealand Treasury. (2025). He Tirohanga Mokopuna 2025 – Long-term Fiscal Statement. https://www.treasury.govt.nz/publications/ltfp/he-tirohanga-mokopuna-2025

⁵ Stats NZ. (2024). Population estimates and projections. https://www.stats.govt.nz

⁶ Ministry of Social Development. (2025). New Zealand Superannuation recipient data.

⁷ Work and Income. (2024). Change to residence criteria for NZ Super and Veteran’s Pension. https://workandincome.govt.nz/eligibility/seniors/nz-super-and-veterans-pension-residency-changes-2024.html

$3 at the Pump — Crisis, Panic, or a Lesson We Refused to Learn?

Article #449

The average price of unleaded 91 jumped 14 NZD cents over a single weekend — and suddenly, commentators are reaching for the kind of language we last heard during COVID. Back then, we fought over toilet paper. Today, the panic commodity is petrol.

Let us first take a breath and assess.

The cause: Iran’s effective closure of the Strait of Hormuz (which handles about a quarter of the world’s seaborne oil trade). This of course follows retaliatory strikes after a US and Israeli attack on Iran in late February. [1]

The effect: Global oil prices have surged past US $100 per barrel, with Brent and WTI hitting around US$110 to US$114 at the height of the crisis. That pain is not contained to the petrol forecourt. It is flowing into every corner of our economy simultaneously, because energy is embedded in the cost of producing virtually everything. [1]

The most visible casualty so far is Air New Zealand, another unfortunately familiar occurrence. Our majority state-owned carrier has cancelled approximately 1,100 flights through early May, impacting around 44,000 passengers. In USD, jet fuel spiked from around $85 per barrel before the conflict to between $150 and $200, with the refinery crack spread (the margin between crude oil and refined jet fuel) blowing out from $22 to as high as $115 per barrel. That’s a structural blow to an airline already recording losses, and it has suspended its full-year earnings guidance entirely because the numbers no longer make sense. [2–5]

Finance Minister Nicola Willis has cited New Zealand's 50 days of fuel supply as a form of reassurance, but the public must read the fine print carefully. That figure includes fuel still sitting on tankers at sea, in transit from the very region in crisis. The fuel physically on New Zealand soil is closer to 28–33 days, depending on the product. [6]

More concerning still, that onshore storage is heavily concentrated around the former Marsden Point site in the north. That means regional centres and the entire South Island operate effectively on just-in-time supply and sit at the end of an extra coastal-shipping leg that adds its own layer of vulnerability. If supply were completely cut off today, New Zealand could sustain itself for roughly a month. [6,7]

That is not 50 days — and it should reframe the conversation entirely.

Muldoon-era carless days, last deployed between July 1979 and May 1980, are being discussed as a last resort. The mere fact we’re having this conversation in 2026 should give everyone pause. [8]

This is where a Canny View requires plain speaking.

Energy is not a lifestyle choice. It is the oxygen of economic activity. Every business—whether moving freight, running a dairy farm, manufacturing product, or providing professional services—consumes energy somewhere in its cost structure. When that cost surges sharply and suddenly, the business faces exactly three options:

  1. Pass the increase to the customer.

  2. Absorb it through productivity gains and efficiency.

  3. Close their doors.

There is no fourth option. This is precisely why energy price shocks are so broadly inflationary. They don’t strike one sector. They strike all sectors at once.

For shareholders and business owners, the message is clear. A viable business must pay its bills, pay its staff, and generate sufficient return to keep capital engaged. When a major uncontrollable cost input (like energy) doubles overnight, that margin compresses fast.

The businesses weathering this shock best are those that made deliberate investments in energy resilience during the quieter years. Fleet operators who transitioned to hybrid or electric vehicles, alongside conventional petrol and diesel workhorses, are finding their total fuel bill meaningfully lower today. Those with suitable rooftops or landholdings who installed solar are generating their own daytime electricity, reducing grid dependency when traditional energy costs are most volatile.

Neither investment requires ideological conviction, only the basic financial discipline of stress-testing a cost structure and acting before the stress arrives.

Resilience is built in calm weather, not in a storm.

Now to the harder conversation — one that goes well beyond oil.

New Zealand's coal reserves exceed 15 billion tonnes, spread across Waikato, Taranaki, the West Coast, Otago and Southland. Our West Coast bituminous coal is internationally prized for its exceptionally low sulphur, low ash, and low phosphorus content — a premium quality product valued by the global steel industry. Yet Genesis Energy's Huntly Power Station sources most of its coal from Indonesia, with imports surging 311% in 2024 as domestic gas supply fell faster than expected. [9–11]

We export quality. We import what we need to keep the lights on. It’s a paradox, not a viable strategy.

The same logic applies offshore. Geological surveys estimate a 90% probability that New Zealand holds undiscovered oil reserves of at least 1.9 billion barrels, with a 50%  probability that the figure reaches 6.5 billion barrels. We are not a Saudi Arabia. But we are far from a barren rock. [12]

Which brings us to the captain's calls demanding accountability — plural, because there were more than one.

In 2018, then-Prime Minister Jacinda Ardern unilaterally banned all new offshore oil and gas exploration permits—no parliamentary vote, no Select Committee process, no national conversation. One announcement. Then, under the same Ardern government, New Zealand's only oil refinery at Marsden Point was closed and permanently decommissioned in 2022. The owner has since confirmed there is no prospect of restarting it; it would take billions of dollars and years of work to rebuild what took decades to establish. Associate Energy Minister Shane Jones described the closure as having fatally wounded New Zealand's fuel security. It’s difficult to argue otherwise this week. [13,14]

An uncomfortable but instructive parallel comes to mind. During Stalin's forced collectivisation in Ukraine in the early 1930s, a nation sitting atop some of the world's most productive agricultural land experienced a devastating famine while grain continued to be exported across its borders. The resources existed, and the policy choices negated them.

New Zealand is not Ukraine, and this is not the Holodomor, but the underlying dynamic—voluntarily denying access to domestic resources while importing vulnerability from abroad—is a pattern worth acknowledging.

A nation surrounded by grain, starving. A nation surrounded by hydrocarbons, panicking at the pump.

Muldoon would be baffled. His Think Big programme in the early 1980s was explicitly designed to convert New Zealand's own natural gas into synthetic fuels, fertiliser and methanol, and reduce oil import dependency following the 1973 energy shock. Think Big was expensive and its outcomes were mixed. But the underlying instinct — that a small, geographically isolated nation at the bottom of the world needs to take energy sovereignty seriously — wasn’t wrong. [15]

Domestic production does not fully insulate a small open economy from global prices. But it reduces the foreign exchange drain of pure import dependency, supports local employment, generates royalties and tax revenue for the Crown, and critically – reduces exposure to the shipping disruptions and geopolitical shocks we are living through right now. In times of crisis, a country with some domestic production and refining capacity is materially more resilient than one with neither.

The toilet paper panic of 2020 passed, and we learned almost nothing from it. Let us use this one differently: we need to have the serious, unsentimental conversation about energy sovereignty that we should have started long before Ardern's captain's call made it more urgent than it ever needed to be. We’ve missed the boat on energy resilience, and the storm has arrived; all we can do now is fortify ourselves to better weather the next one.


Nick Stewart

(Ngāi Tahu, Ngāti Huirapa, Ngāti Māmoe,
Ngāti Waitaha)

Financial Adviser and CEO at Stewart Group

  • Stewart Group is a Hawke's Bay and Wellington based CEFEX & BCorp certified financial planning and advisory firm providing personal fiduciary services, Wealth Management, Risk Insurance & KiwiSaver scheme solutions.

  • The information provided, or any opinions expressed in this article, are of a general nature only and should not be construed or relied on as a recommendation to invest in a financial product or class of financial products. You should seek financial advice specific to your circumstances from a Financial Adviser before making any financial decisions. A disclosure statement can be obtained free of charge by calling 0800 878 961 or visit our website, www.stewartgroup.co.nz


References

  1. NZ Herald, Petrol prices expected to hit at least $3 a litre in some places, March 2026

  2. Flight Global, Fuel price volatility prompts Air New Zealand to suspend earnings guidance, March 2026

  3. Global Banking & Finance Review, Air New Zealand cut flights, fuel price surge wreaks havoc, March 2026

  4. AeroTime, Air NZ to cut 1,100 flights amid soaring fuel prices, March 2026

  5. NZX Announcement, Air New Zealand suspends FY2026 guidance, March 2026

  6. RNZ, How much fuel does NZ have — and what happens if we run out?, March 2026

  7. Infonews, NZ Fuel Situation — South Island Vulnerabilities, March 2026

  8. NZ Herald, Carless days are no solution to an oil shock (Liam Dann), March 2026

  9. Wikipedia, Coal in New Zealand, citing USGS and MBIE data

  10. USGS Fact Sheet 2004-3089, New Zealand Coal Resources

  11. Ministry of Business, Innovation & Employment, Energy in New Zealand 2025 — Coal

  12. New Zealand Parliament, The Next Oil Shock?, citing Institute of Geological and Nuclear Sciences 2009

  13. NZ Herald, First look: Inside Northland's Marsden Point oil refinery post-shutdown, November 2024

  14. NZ Herald, Inquiry into reopening New Zealand's only oil refinery, March 2024

  15. Wikipedia, Think Big, New Zealand Third National Government economic strategy

Iran, Oil, and Your Retirement Savings: Separating the Signal from the Noise

Article # 447

The New Zealand media has had a busy week connecting the US and Israeli strikes on Iran to your wallet. Some of it is legitimate. Some of it is noise dressed up as financial guidance. Knowing which is which - now that’s useful.

Let's start with what’s real.

The Strait of Hormuz: A known pressure point

The Strait of Hormuz is a roughly 33km-wide chokepoint between the Persian Gulf and the Gulf of Oman. Around 20% of the world's daily oil supply and a similar share of global liquefied natural gas trade passes through it every single day, mostly bound for China, India, Japan, and South Korea.¹

This waterway has been a pressure point for decades. Iran mined it during the Iran-Iraq War in the 1980s, prompting direct US military intervention in what became known as the Tanker War (during which more than 500 vessels were damaged or destroyed).² In December 2011, Iran threatened closure in response to Western sanctions, triggering the deployment of a US-British-French naval flotilla. In 2019, tanker seizures and attacks on shipping spiked tensions again. In June 2025, Israel's strikes on Iranian nuclear facilities prompted Iran's parliament to pass a motion recommending closure, though that did not materialise into a full blockade.³

The point is this: the Strait of Hormuz has been a geopolitical instrument for Iran for more than 40 years. Successive US administrations, allies, and global energy markets have navigated those threats repeatedly. Every episode generated alarming coverage. Yet every episode passed. That does not make the current situation trivial, but it does provide context that breathless headlines rarely bother to include.

New Zealand's real exposure

Importantly, New Zealand has direct and specific economic exposure to this conflict.

According to the Meat Industry Association (MIA), nearly all of New Zealand's red meat exports to the Gulf Cooperation Council (Bahrain, Kuwait, Oman, Qatar, Saudi Arabia, and the UAE) travel through the Strait of Hormuz. In 2025, that trade was valued at $298 million, including $166 million in chilled exports, which are the most time-sensitive.⁴

Supply chain firm Kotahi, which handles freight on behalf of Fonterra and Silver Fern Farms, has confirmed that all major shipping lines have suspended services through the strait, with some 4,000 containers of New Zealand export cargo currently in transit.⁴

Fuel prices are also a legitimate concern. New Zealand no longer imports crude directly from the Middle East, but petrol is priced in a global market. Brent crude spiked more than 8% when trading opened after the weekend strikes.⁵ Analysts at JPMorgan and Citigroup have warned that sustained disruption could embed a significant geopolitical premium for weeks.

The New Zealand Ministry of Foreign Affairs and Trade has noted that rising fuel costs do not just show up at the pump. They pervade the economy through transport, logistics, and consumer prices – and may force the Reserve Bank to respond with always-dreaded interest rate adjustments.⁶

One lesser-discussed exposure: approximately one-third of the world's fertiliser trade also passes through the Strait of Hormuz, meaning prolonged disruption could eventually flow through to agricultural input costs. This is directly relevant to a primary-export economy like New Zealand's. ⁷

So yes, there are real and specific things worth monitoring here. Beyond fearmongering, we must consider geography and economic forces decades in the making.

Now for the noise...

Here’s where some of the coverage starts to serve the headline more than the reader.

At 7:56 am on Monday, 2 March, before Wall Street had even opened for the day, 1News published a piece headlined "Iran attack sparks warning for KiwiSaver, fuel, inflation."

Readers were told to brace for volatility, expect red ink in their KiwiSaver, and anticipate a flight to safer assets.⁸ By the time New Zealand investors had read that article over their morning coffee, absorbed the alarm, and perhaps reached for their phones to switch funds... Wall Street had opened, dipped 1.2%, and was already recovering. The S&P 500 closed that Monday virtually unchanged, finishing the session up just 0.04%.⁹

The warning had outrun the facts by an entire trading day.

Alarming coverage is produced in real time, often ahead of the facts. By the time reality arrives, in this case, a market that largely shrugged off the initial shock and bought the dip, most people have already absorbed the panic as truth and may have acted on it.

Advising the average investor to urgently check their KiwiSaver balance and consider switching funds is, for most people, bad advice dressed up as financial concern. This applies equally to any well-constructed investment portfolio underpinned by a comprehensive financial plan.

The latest data from the Retirement Commission puts the average KiwiSaver balance at $37,079 and the average member age at approximately 44.¹⁰ That means the typical New Zealand investor has roughly 20 to 25 years of accumulation ahead before they reach 65. Long-term KiwiSaver growth funds have historically returned between 7% and 9% annually.¹¹ Across that kind of horizon, even a meaningful short-term market dip is a rounding error in the final outcome.

The pattern markets have seen repeatedly, last June's brief Israel-Iran exchange being a useful recent reference point, is as follows:

  1. Equity markets sell off sharply on geopolitical shock.

  2. They recover once it becomes clear the worst-case scenario has not materialised.

  3. Investors who switched to conservative funds during that episode locked in losses they then missed recovering as markets rebounded.

The same logic applies whether you hold KiwiSaver,  managed funds, or a direct share portfolio.

A comprehensive financial plan is engineered to withstand volatility. Abandoning it because of a week of alarming headlines is not a financial decision; it is an emotional one.

Four genuine reasons to review your investments

The right time to review your asset allocation or contribution settings is when your circumstances change — not when the news cycle does.

  1. Has your income shifted significantly?

  2. Are you approaching 65 and still in an aggressive growth fund that no longer reflects your timeline?

  3. Has your risk tolerance genuinely changed — not because of a week of coverage, but because of a considered, honest look at your financial position and goals?

  4. Are there changes to your broader financial plan that warrant a portfolio rebalance? These are all valid triggers for a conversation with your financial adviser.

But if your goals, your timeline, your income, and your broader financial picture are the same today as they were a fortnight ago, and for most people they are, the rational position is to stay the course.

A well-built investment portfolio is designed to absorb decades of global volatility. Many such portfolios have weathered the Global Financial Crisis, the COVID-19 crash, the 2022 rate shock, and last June's regional conflict. Each of those episodes generated similar headlines. Each time, disciplined investors who stayed the course came out ahead of those who did not.

When others are running from the fire

Warren Buffett has made a career of running towards financial fires, not away from them. Writing in the depths of the Global Financial Crisis, his philosophy spoke to financial discipline over the furore of the day: "Whether we're talking about socks or stocks, I like buying quality merchandise when it is marked down."¹²

The irony of a market downturn? Precisely when assets go on sale is when most investors want nothing to do with them; it’s when they are expensive and rising that everyone wants in. Buffett's instruction has always been the opposite: be fearful when others are greedy, and greedy when others are fearful. That’s not a comfortable stance when headlines are blaring an alarm. But discomfort and bad decision-making are not the same thing.

This is where a structured, disciplined rebalancing strategy earns its keep.

When equities fall, and fixed income or defensive assets hold their ground, a rebalancing framework triggers a deliberate, rules-based response: trim what has held up, add to what has fallen. Not because of a hunch. Not because of a headline. Because the plan said so before any of this happened.

That’s the discipline Buffett is describing. Not panic, not paralysis — but a pre-committed process that removes emotion from the equation and replaces it with structure. The investors who do best through periods like this are not the ones who predicted the conflict or called the bottom. They’re the ones who had a plan, stuck to it, and let systematic rebalancing do what it was designed to do.

Discipline pays off

The media's job is to make you read the next paragraph. Your financial plan's job is to compound quietly over decades. These two objectives are not aligned – and it’s worth remembering that when the very same article explaining why oil prices are rising pivots abruptly to urging you to check your KiwiSaver.

There is genuine news here worth following closely: shipping disruptions, petrol prices, fertiliser costs, red meat export disruptions, and what unfolds in the Strait of Hormuz over the coming weeks are all legitimately important to New Zealand households and businesses. Read those stories. Understand the exposure.

But when the coverage drifts into urging reactive investment decisions based on today's headlines, that is where you put the phone down, flick on the kettle, and make yourself a brew instead of making rash investment decisions.

Your future self will thank you.


Nick Stewart

(Ngāi Tahu, Ngāti Huirapa, Ngāti Māmoe,
Ngāti Waitaha)

Financial Adviser and CEO at Stewart Group

  • Stewart Group is a Hawke's Bay and Wellington based CEFEX & BCorp certified financial planning and advisory firm providing personal fiduciary services, Wealth Management, Risk Insurance & KiwiSaver scheme solutions.

  • The information provided, or any opinions expressed in this article, are of a general nature only and should not be construed or relied on as a recommendation to invest in a financial product or class of financial products. You should seek financial advice specific to your circumstances from a Financial Adviser before making any financial decisions. A disclosure statement can be obtained free of charge by calling 0800 878 961 or visit our website, www.stewartgroup.co.nz

  • Article no. 447


References

[1] US Energy Information Administration. (2024). Strait of Hormuz — World's Most Important Oil Chokepoint. https://www.eia.gov/international/analysis/special-topics/World_Oil_Transit_Chokepoints

[2] Ratner, M., Lawson, A., & Brock, J. (2025). Iran Conflict and the Strait of Hormuz: Oil and Gas Market Impacts. Congressional Research Service. https://www.congress.gov/crs-product/R45281

[3] Times of Israel. (2026, March 1). Strait of Hormuz: Key Oil Route in Middle of Iran Crisis. https://www.timesofisrael.com/strait-of-hormuz-key-oil-route-in-middle-of-iran-crisis/

[4] Meat Industry Association NZ / Kotahi NZ. (2026, March 1). Statements on Strait of Hormuz shipping disruption. Reported in NZ Herald. https://www.nzherald.co.nz/business/us-iran-conflict-threatens-nz-red-meat-exports-via-strait-of-hormuz

[5] Franck, T., & Imbert, F. (2026, February 28). Markets Brace for Impact After US Strikes Iran. CNBC. https://www.cnbc.com/2026/02/28/markets-brace-for-impact-following-us-military-strikes-against-iran.html

[6] New Zealand Ministry of Foreign Affairs and Trade. (2025, July). NZ Economy Not Immune to Conflict in the Middle East. https://www.mfat.govt.nz/en/trade/mfat-market-reports/nz-economy-not-immune-to-conflict-in-the-middle-east-july-2025

[7] Stojanovic, U., & Bradshaw, T. (2026, March 1). Strait of Hormuz: If the Iran Conflict Shuts the World's Most Important Oil Chokepoint, Global Economic Chaos Could Follow. The Conversation. https://theconversation.com/strait-of-hormuz-if-the-iran-conflict-shuts-worlds-most-important-oil-chokepoint-global-economic-chaos-could-follow-277199

[8] Edmunds, S. (2026, March 2). Iran Attack Sparks Warning for KiwiSaver, Fuel, Inflation. RNZ / 1News. Published 7:56am. https://www.1news.co.nz/2026/03/02/iran-attack-sparks-warning-for-kiwisaver-fuel-inflation/

[9] CNBC Markets Desk. (2026, March 2). Stock Market Today: S&P 500 Ends Monday Just Above the Flatline, Rebounding from Sharp Declines. CNBC. https://www.cnbc.com/2026/03/01/stock-market-today-live-update.html

[10] Reyers, M. (2025, March). KiwiSaver Member Data — December 2024. Te Ara Ahunga Ora Retirement Commission / Melville Jessup Weaver. Reported in: Edmunds, S. What Average KiwiSavers' Balances Are at Your Age. RNZ News. https://www.rnz.co.nz/news/business/545015/what-average-kiwisavers-balances-are-at-your-age

[11] MoneyHub NZ. (2024). Average KiwiSaver Balance by Age. https://www.moneyhub.co.nz/average-kiwisaver-balance-by-age.html

[12] Buffett, W. (2008). Berkshire Hathaway Inc. Chairman's Letter to Shareholders. Berkshire Hathaway. https://www.berkshirehathaway.com/letters/2008ltr.pdf

Fonterra Sale: A Once-in-a-Generation Opportunity for Financial Balance

Article # 446

Fonterra's shareholder approval of the $3.2 billion capital return from the Mainland Group sale has now been rubber-stamped. Farmers are set to receive an average of $392,000 per operation—some larger operations receiving over $2-3 million.¹

The deal, which saw 88% support back in October when the $4.2 billion sale to French dairy giant Lactalis was approved, represents a watershed moment for New Zealand dairy farmers. Last week's special meeting confirmed the capital return arrangements through a scheme of arrangement, with settlement expected any time between now and the end of March.²

JHVEPhoto - stock.adobe.com

Around 60% of shareholding farms will receive at least $200,000, while some of the co-op's largest shareholders will receive over $2-3 million. Southland's Fortuna Group, with more than 4.4 million shares, will receive close to $9 million, while state-owned farmer Pāmu could receive $10 million.²

This reflects the sector's strategic maturity and forward-thinking approach to wealth creation beyond a single generation. It's a recognition that the most resilient farming families build diversified financial structures that can support their operations and families through all market cycles.

The balance of the sale proceeds is being retained by Fonterra to reinvest in its ingredients and foodservice businesses, with some cash used to retire debt or applied as working capital. Fonterra forecast its balance sheet metrics to stay in line with targets, being debt to EBITDA of less than 3x and gearing of 30-40%.²

Understanding Real Returns: The Smart Farmer's Perspective

Savvy farmers know headline numbers don't tell the whole story.

While the recent $10.16 per kilogram of milk solids farmgate price represents a nominal record,³ astute operators understand the critical importance of inflation-adjusted returns when assessing true profitability.

The previous high-water mark came in the 2013/14 season at $8.40 per kilogram.⁴ At first glance, this suggests farmers are now receiving approximately 21% more per kilogram than they did eleven years ago. However, this comparison becomes meaningless when examined through the lens of actual input cost inflation that has fundamentally transformed farm economics.

The rising cost of production

Between 2019 and 2024, the average total cost for milk production across major exporting regions increased by around 14%, with over 70% of that increase occurring since 2021.⁵ While on-farm inflation peaked at 10.2% in the year to March 2022,⁶ costs remained elevated through 2023 before moderating slightly in 2024. However, the cumulative impact since 2013 is huge.

The structural cost uplift is evident across every input category. From 2018-19 to 2024-25:

  • Interest costs for an average dairy farm rose 86.5%, from $187,182 to $246,416 annually.⁷

  • Insurance costs increased approximately 33% over five years, with insurance premiums now succeeding fertiliser and interest rates as a major cost pressure in 2024.⁸

DairyNZ estimates dairy operating expenses reached $8.16 per kilogram of milk solids in 2022/23, up sharply from $7.23 in 2021/22.⁹ The national break-even farmgate milk price for the 2024/25 season is $7.76 per kilogram of milk solids.¹⁰

Fertiliser costs saw some products skyrocket from $799 per tonne to $1,800 per tonne during the peak inflation period.¹¹ While prices moderated in 2024 (declining 4.2% in the sheep and beef sector),¹² the cumulative impact of years of price escalation remains embedded in farm cost structures. Additionally, feed costs for dairy farms rose 28.2% between 2020-21 and 2022-23.¹³

Added pressure from interest rates

While the Official Cash Rate has fallen to 2.25%, medium and longer-term fixed mortgage rates have been rising since December 2025. Wholesale interest rates have increased more than half a percentage point since November, with banks lifting 2-5 year fixed rates accordingly.

ASB's 2-year rate now sits at 4.95% and 3-year at 5.19%, while Westpac's 4-year rate has risen to 5.19% and 5-year to 5.29%.¹⁴ Markets are pricing in potential OCR hikes from mid-2026 as inflation sits at 3.1%, above the Reserve Bank's 1-3% target band.¹⁴

This dynamic creates renewed debt servicing pressure for farmers despite the falling OCR. The disconnect between short-term policy rates and longer-term borrowing costs reflects market expectations about future inflation and the eventual return to higher rates.

Smart farmers recognise this reality: $10 per kilogram milk price (while excellent in nominal terms) represents the outcome of working harder, investing more capital, and operating more efficiently within a structurally higher cost environment. When you strip away the nominal gains and examine purchasing power, farmers aren't substantially better off than they were at the previous peak. They've simply adapted to significantly higher operating costs.

The best operators understand that sustainable wealth creation requires thinking strategically beyond the farm gate. Relying solely on commodity price increases that barely keep pace with input cost inflation is not a wealth-building strategy, it's survival.

Extreme Volatility Demands Resilience

Recent price swings have been dramatic, rapid, and unpredictable – proving why wealth structures beyond farm gate are essential for multi-generational farming families.

The season opened in August 2025 with Fonterra forecasting a midpoint of $10 per kilogram with a wide range of $8-$11 per kilogram.¹⁵ For several months, this appeared achievable as prices held firm.

December’s dairy downturn

After nine consecutive Global Dairy Trade auction declines, Fonterra cut its farmgate milk price forecast for the second time in the season in December. It dropped from the season-opening midpoint of $10 per kilogram down to $9 per kilogram with a narrowed range of $8.50-$9.50.¹⁶ Whole Milk Powder prices had fallen 5.7%, having declined nearly 28% from their May peak.¹⁶

Market commentary was uniformly bearish, with analysts warning of sustained supply-side pressure and global milk flows outstripping demand. The outlook was grim. Farmers adjusted budgets, planned for lower cashflows, and braced for a difficult season.

Then, in a remarkable reversal, the market staged a recovery.

An unexpected upswing

Four consecutive positive Global Dairy Trade auctions saw prices surge back to September levels.¹⁷ Whole Milk Powder, which accounts for half the auction by volume and has the greatest influence on farmgate milk price, rose 2.5% to US$3,706 per metric tonne in late February. Skim milk powder increased 3% to US$2,973 per metric tonne, while butter surged 10.7% to US$6,347 per metric tonne.¹⁷

Last Friday (February 20, 2026) Fonterra responded to this market recovery by lifting its forecast again, just ten weeks after the December cuts. The co-op raised the midpoint from $9.00 to $9.50 per kilogram with a new range of $9.20-$9.80.¹⁸ CEO Miles Hurrell cited "recent improvements in global commodity prices combined with Fonterra's well contracted sales book."¹⁸

Additionally, Fonterra announced a special dividend of 14-18 cents per share from the entire fiscal 2026 underlying earnings generated by Mainland Group, payable following the completion of the sale to Lactalis.¹⁸

Volatility as a hard-learned lesson

This whipsaw journey (from $10, to $9, to $9.50) over the course of just four months illustrates the fundamental challenge facing farming families who depend entirely on commodity prices for wealth creation.

These aren't gradual, predictable shifts that allow for careful planning. They're rapid, material changes driven by global supply and demand dynamics that individual farmers cannot influence or accurately predict. In August, the outlook appeared strong. By December, it appeared dire. By February, it had recovered.

What will it look like in May? July? No one knows.

This volatility creates genuine financial planning challenges for families trying to build intergenerational wealth. How do you plan for retirement, fund the next generation's education, or structure succession when your primary income source can swing 10-20% in a matter of weeks?

Critically, even as Fonterra lifted its forecast, CEO Hurrell acknowledged that "global milk production remains above seasonal norms, meaning the risk of further volatility in pricing remains."¹⁸ In other words, yesterday's good news could reverse again next month. The unpredictability is structural, not temporary.

History guarantees there’ll be another downturn. You need to establish whether your family's financial security depends entirely on timing those cycles correctly, or whether you've built diversified wealth structures that can weather volatility while continuing to generate real returns.

Learning from the Best for Diversification

The most successful farming enterprises share one common characteristic: off-farm assets that aren't correlated to dairy commodity cycles.

The farm is the engine of wealth generation, but it shouldn't be the sole repository of wealth. Diversification creates financial resilience, provides genuine optionality, and reduces dependence on factors beyond the farm gate.

Strategic diversification into property, shares, managed funds, or other investments can provide income streams that aren't dependent on global dairy prices, exchange rates, or seasonal conditions. These assets have the potential to generate real returns above inflation. They can create genuine wealth growth, rather than simply keeping pace with rising costs.

Diversification also provides crucial liquidity that farm assets cannot deliver. When opportunities arise—whether that's acquiring neighbouring land, investing in new technology, or supporting the next generation's education—liquid investments can be accessed without forcing farm asset sales at potentially disadvantageous times. When emergencies occur, diversified wealth provides options and reduces stress.

This builds a comprehensive financial strategy that supports both farm and family for generations. The farm remains the core productive asset and the foundation of family identity and purpose – within a broader wealth structure providing stability, optionality, and genuine financial security through all market conditions.

Many farmers intend to reinvest this capital return into their farming operations.² This makes sense for operations with clear productivity improvements available. However, the most strategic approach balances on-farm reinvestment with genuine diversification beyond the farm gate.

There’s a question every farming family should ask: if we reinvest everything back into the farm, are we building wealth – or simply maintaining our exposure to a single asset class subject to extreme volatility and structural cost inflation?

Ensuring Quality Advice

As farmers contemplate deploying this imminent capital, the relationship with their financial adviser becomes paramount. This may be the largest single capital deployment decision many farming families ever make. Getting it right requires an adviser who is genuinely and legally committed to putting your interests first.

Will your adviser provide a written statement affirming that the advice relationship is of a fiduciary nature, where your interests unequivocally surpass those of the adviser?

Under New Zealand's financial advice regime, advisers are legally required to put their clients' interests first when giving advice and to prioritise their clients' interests over any conflicts.¹⁹ However, requiring your adviser to put this commitment in writing—in clear, unambiguous language—separates those who truly embrace fiduciary responsibility from those who simply meet minimum compliance standards.

Request a letter explicitly stating that all recommendations will prioritise your long-term financial wellbeing over commission structures, conflicts of interest, product preferences, or any other adviser considerations. This letter should confirm:

  • That the adviser will put your interests unequivocally ahead of their own

  • That they will disclose all conflicts of interest proactively

  • They will recommend only investments and strategies that serve your long-term objectives

  • Their compensation will be structured in alignment with your success

  • They will provide ongoing accountability for the advice given

If an adviser hesitates or refuses to provide this written commitment, that tells you everything you need to know about where their priorities truly lie. The best advisers welcome this clarity because it aligns with how they already operate.

It’s not about distrust—it's about establishing crystal-clear accountability in what may be the most significant financial planning exercise of your farming career.

Payment is Imminent – What About a Plan?

The timeline has crystallised. With settlement expected between now and the end of March,² farmers have mere weeks before capital arrives. The Overseas Investment Office approval cited the $3.2 billion direct injection of capital to New Zealand farmers as a strong economic benefit, alongside Lactalis' $100 million capital expenditure commitment and ongoing supply arrangements.² Finance Minister Nicola Willis confirmed the transaction met the "benefit to New Zealand test."²

For farmers who haven't yet engaged in comprehensive financial planning, the time to act is now—not after the money arrives. Once capital is in the bank account, the psychological pressure to "do something" with it can lead to reactive decisions, not strategic ones.

Execute on robust financial planning that diversifies wealth beyond agricultural assets into uncorrelated investments, creates multiple income streams independent of commodity cycles and inflation erosion, structures tax-efficient wealth transfer to the next generation, provides financial resilience and liquidity against future market downturns, and builds genuine intergenerational wealth that can support family objectives for decades.

Work with advisers now to develop comprehensive plans, have thorough family discussions about objectives and succession, and ensure structures are ready for when the capital arrives. The planning should happen now; the deployment happens when the money is in your account.

The Bottom Line

The dairy sector has proven its resilience, discipline, and strategic thinking through multiple crisis periods. But dependence on commodity prices alone creates unnecessary risk for farming families seeking to build multi-generational wealth.

Now, thanks to the Fonterra sale, farmers can take the next strategic step—building financial structures that weather all cycles and generate real wealth across generations. Beyond the next season, or even the next decade, this is about creating financial security that supports your family's farming legacy for the next century.

The question becomes whether you'll deploy the capital strategically, with proper advice, appropriate diversification, with explicit attention to generating real returns above inflation.

With capital arriving imminently and markets demonstrating their unpredictability daily, the time for planning is now. The most successful farmers will approach this thoughtfully, strategically… and with professional, fiduciary guidance that puts their interests unequivocally first.

Nick Stewart

(Ngāi Tahu, Ngāti Huirapa, Ngāti Māmoe,
Ngāti Waitaha)

Financial Adviser and CEO at Stewart Group

  • Stewart Group is a Hawke's Bay and Wellington based CEFEX & BCorp certified financial planning and advisory firm providing personal fiduciary services, Wealth Management, Risk Insurance & KiwiSaver scheme solutions.

  • The information provided, or any opinions expressed in this article, are of a general nature only and should not be construed or relied on as a recommendation to invest in a financial product or class of financial products. You should seek financial advice specific to your circumstances from a Financial Adviser before making any financial decisions. A disclosure statement can be obtained free of charge by calling 0800 878 961 or visit our website, www.stewartgroup.co.nz

  • Article no. 446


References

  1. BusinessDesk (19 February 2026). "Fonterra farmers set to rubber stamp $3.2b Mainland Group capital return". ASB estimated average return at $392,000, with 60% receiving at least $200,000.

  2. BusinessDesk (19 February 2026). Settlement expected between now and end of March 2026.

  3. NZ Herald (26 September 2025). Final farmgate milk payout reached $10.16 per kilogram of milk solids.

  4. NZ Herald (18 March 2025). In 2013/14 season, Fonterra paid $8.40/kg.

  5. Rabobank (18 February 2025). Between 2019 and 2024, average total cost increased 14%, with over 70% since 2021.

  6. NZ Herald (22 August 2022). On-farm inflation 10.2% for year to March 2022.

  7. Farmers Weekly (4 June 2024). Interest costs rose 86.5% from $187,182 (2018-19) to $246,416 (2024-25).

  8. USDA (2025). In 2024, insurance premiums succeeded fertiliser and interest rates as major cost pressure.

  9. Infometrics (August 2023). Operating expenses at $8.16 per kgMS in 2022/23.

  10. DairyNZ (2024). Break-even at $7.76 kg/MS for 2024/25.

  11. NZ Herald (22 August 2022). One fertiliser increased to $1,800/tonne from $799/tonne.

  12. Beef + Lamb NZ (June 2024). Fertiliser declined 4.2% in 2023-24.

  13. DairyNZ. Feed costs rose 28.2% between 2020-21 and 2022-23.

  14. RNZ (9 February 2026) and Opes Partners (25 February 2026). ASB: 2-year at 4.95%, 3-year at 5.19%; Westpac: 4-year at 5.19%, 5-year at 5.29%. Wholesale rates up over half a percentage point. Note: BNZ reversed recent rate hikes on 27 February 2026, cutting 3-year to 4.99%, 4-year to 5.19%, 5-year to 5.29%.

  15. Fonterra (August 2025). Season opened at $10/kg midpoint with range $8-$11/kg.

  16. Farmers Weekly (18 December 2025). Fonterra cut forecast to $9/kg midpoint, range $8.50-$9.50, following nine consecutive GDT declines.

  17. BusinessDesk (19 February 2026). WMP rose 2.5% to US$3,706/MT, SMP 3%, butter 10.7% following four consecutive positive auctions.

  18. Reuters/Fonterra (20 February 2026). "NZ's Fonterra lifts annual milk price forecast, teases special dividend". New midpoint $9.50/kg, range $9.20-$9.80. Special dividend 14-18 cents per share from Mainland Group FY26 earnings. CEO noted volatility risk remains.

  19. FMA New Zealand. Advisers must put client's interests first.