
Investors at year-end are inclined to reflect on the 12 months gone and muse on what the coming year might bring.Aware of this appetite for speculation, the media tends to feed it with forecasts. These articles can be fun to read but are even more so a year later.
Advisory firms law changes look like Aussie model
Smaller advice firms in New Zealand could find the new legislative regime is harder to deal with than they expect if the Australian experience is anything to go by. The Financial Markets Authority has indicated that it will allow the requirements of licensing to be tailored to fit the needs of smaller firms.
Bitcoin bubble, the new tulip mania Part II
ver the years there have been numerous economic bubbles and subsequent crashes, for example, the dot-com bubble, the stock-market bubble, and the real estate bubble.
But the one few may be aware of is the tulip bulb market bubble (also known as tulip mania) of the 17th century in the Netherlands.
The bitcoin bubble – Part I
What if there is a technological advancement so powerful that it transforms the fundamental pillars of our society?
A technology that fundamentally influences the way our economy, governance systems and business functions, and could change our conceptual understandings of trade, ownership, and trust.
Ponzi schemes and fools' gold
You've probably heard the saying "If it sounds too good to be true, it probably is." This rings particularly true in the case on Ponzi schemes.
A Ponzi scheme is not a new wonder drug or an Italian beach resort, it's terrible for your financial health.
Trust Law Reform Part II- You'd best be prepared if trusts bill becomes law
The proposed law changes will mean the right to have the trust properly managed, in accordance with the trust deed, is paramount. Many trustees will need to balance these considerations, and it will be difficult.
Trust law reform Part I - benefits versus costs, responsibilities
With 300,000 to 500,000 trusts operating in New Zealand, a new trusts bill introduced to Parliament earlier this year has the potential to deliver wide-ranging impacts.
Booster boosts fund options, tweaks settings
The balanced fund joins its Asset Class growth and conservative siblings, which are ultimately managed by US factor-based investment house Dimensional Fund Advisors.
House prices out of step
House prices in New Zealand versus the average Kiwi income have more than doubled since 1980.If you thought house prices were hot, you were right, but this figure shows home ownership is becoming a more and more distant dream for the average New Zealander, unless we see market slow-down or correction
Leaving Home?

Everybody loves the comforts of home, but investors who become too anchored to familiar territory can end up with a very narrow view of the world.
Home bias, the tendency of investors to allocate a disproportionate amount of their funds to their domestic market, is a well-documented phenomenon.
As at 31 December 2016, superannuation funds regulated by the Australian Prudential Regulation Authority had nearly 50% of their total equity exposure in local shares. For self-managed super funds, the average home allocation was 72%.
There can be rational reasons for home bias. Australian investors, for instance, have the advantage of dividend imputation. This is where firms that have already paid income tax on profits attach tax credits in distributions to shareholders.
A second understandable reason they might tilt to their home market is familiarity with the companies they are investing in. Companies like Westpac, ANZ, Qantas and Air New Zealand are household names and are frequently in the news.
A third justification might be that a home bias satisfies an individual investor’s particular goals or risk appetite. These are all issues for an advisor to consider.
But a large home bias also can have undesirable consequences. Those consequences relate to the risks of a portfolio ending up with very concentrated exposure to individual countries, companies, and sectors.
DIVIDING UP THE WORLD
This is particularly the case where your home market is relatively small in a global sense or where it is dominated by one or two sectors.
Chart 1 shows the natural weights of some of the countries in the MSCI All Country World index, a popular benchmark for the global share market. You can see the US is by far the biggest market, with a weight of more than 53% as at 31 January 2017.
Japan is a distant second with a weight just above 8%, then the UK, Canada, France and Germany, China and Switzerland. Australia is ninth with a weight of 2.4%, while New Zealand is in 36th place with a weight of just 0.1%, too small to see on the chart.
Now, what happens when we bias our portfolio to the home market? Chart 2 shows the country representation in an equity portfolio with a home bias of 60% to Australia.
As a result of this tilt, we have to scale down representation of other major markets. For instance, the US exposure is lowered from 53% to 22% and emerging markets from 11% to just 4%. Put another way, the weight of all countries, apart from Australia and the US, in this portfolio is just 18%.
So you can see that this degree of home bias represents a pronounced deviation from the global market portfolio and leaves you taking unnecessarily big bets. For instance, Canada was the best performing developed market in 2016 with a gain of more than 25%. But with our home bias, the weight to Canada is reduced by two thirds.
Since we have no reliable way of predicting which country will be the best performer year of year, it makes sense not to deviate too far from the market portfolio.

DIVIDING UP THE SECTORS
Having a sizeable home bias means not only taking a big bet on a single country, but ending up with a disproportionate exposure to certain sectors.
In Australia’s case, the big four banks represented nearly 28% of the market, as of early 2017. Financials overall made up 38%, while materials stocks represented 17%. In other words, two sectors made up more than half of the market.
To put that into perspective, financials represented just 19% of the global market while materials had a share of just 6%.
Another way of looking at this bias is to consider which sectors are poorly represented in Australia. For instance, information technology stocks made up just 1.3% of the local market, compared to 16% globally.
Chart 3 shows the natural market weight of sectors in a global portfolio. Chart 4 shows what happens when you have a 60% home bias. In other words, you end up taking a significant bet on financials and materials stocks, at the expense of other sectors like technology and healthcare. It’s a much less diversified portfolio.

DIVIDING UP THE STOCKS
We’ve seen that a home bias means concentrated bets on a single country and a couple of sectors. So it shouldn’t be a surprise that it also means you end up taking outsized bets on a handful of stocks.
With a 60% Australian home bias, a single stock—the Commonwealth Bank—will represent nearly 6% of your portfolio. That is more than the weight of the UK and Japan combined or more than your entire holdings in emerging markets.
Put another way, the top five stocks (the four big Aussie banks and BHP Billiton) will make up more than 20% of your portfolio. You will also more than halve your exposure to big overseas names like Apple, Microsoft, Amazon, Vodafone, Nestle and Volvo.
In fact, of the top 50 stocks in this Australian-biased “global” portfolio, all but four are local stocks, the exceptions being Apple, Microsoft, Exxon Mobil and Amazon.
Chart 5 illustrates how concentrated this portfolio becomes once the home bias is accounted for.

PUTTING IT ALL TOGETHER
Given investors tend to source most of their income from their home nation and hold most of their other assets there, you can see that this degree of home bias represents a very big bet on one country, a couple of sectors and a handful of stocks.
So the question then becomes what degree of home bias is acceptable. It shouldn’t be surprising that there is no one right answer to that. It depends on each individual investor’s tastes, preferences, circumstances and goals.
A good approach is to use a global market portfolio as your starting point. If you want to increase the expected return of your portfolio, you can use information in current market prices and company fundamentals to tilt your portfolio towards stocks with higher expected returns. Research has shown that small caps, low relative price and high profitability stocks deliver a premium over the market return.
While you may tilt your portfolio towards Australia for the franking credits or your familiarity with the stocks, it’s important to understand this has nothing to do with the expected return of your portfolio. It is just a preference. But it also comes at a cost.
In contrast, broad global diversification creates a portfolio that spreads its risk to more economies, to a greater number of stocks, to a wider range of companies and to a wider spread of sectors.
Again, there is no single right answer in terms of asset allocation. It will depend on the individual investor’s circumstances, goals and risk appetite.
But it is worth reflecting on the fact that an investor whose allocation is made up 60 percent of Australian equities is overweighting Australia relative to the global market by a factor of 25.
At some time or another, we all have to leave home.
- Source: Jim Parker, Vice President, DFA Australia Limited
In Long Run, There’s No Such Thing as an Einstein Investor
There are no easy answers in investing. It is tempting to replicate a successful strategy — one created by an outstanding investor, like Warren Buffett, or through in-depth statistical analysis of the wisdom of crowds — and such approaches can actually work for long periods.
But paint-by-number portfolios won’t succeed forever. And without deep expertise, it makes little sense to veer much from a simple market portfolio — one that seeks to match the overall performance of the market, and not beat it.
These reflections are prompted by the television series “Genius” (based on the Walter Isaacson biography “Einstein: His Life and Universe”), which I’ve been watching on National Geographic TV. The series also inspired me to reread Einstein’s own popularization of his theories, in the book “Relativity: The Special and General Theory.”
Albert Einstein, who may have been the most famous person ever to be publicly identified as a genius, had a disrespectful attitude toward the dignitaries of the physics profession of his time, and a lonely and unique approach to science.
Yet great as Einstein’s theories were, others in the scientific community had been on the verge of discovering them when he came along. In fact, it is possible to argue that large numbers of collegial scholars who do not keep secrets, do not pretend to know everything and share freely will eventually surpass the achievements of a lone genius.
Similar debates dominate professional investing. For help in making important financial decisions, some of us are looking for Einsteins, others for communities of scholars or professional money managers with solid ideas.
In terms of popular reputation, Mr. Buffett may be investing’s closest approximation of an Einstein. Some investors have done well simply by copying Mr. Buffett’s financial moves.
On the other hand, many investors embrace the catchy methods that bubble up from time to time, like “smart beta,” a phrase for a form of systematic investing that claims to outperform the market. There is no universal agreement on what smart beta means, but it typically refers to published theories and replicable statistical analysis, and mechanical procedures aimed at beating them. Smart beta clearly is the epitome of community property, not a quirky genius.
A lone investor, whether a genius or not, can typically keep a secret better than a community can, and does not have to publish his methods. This difference is important but not absolute because the Securities and Exchange Commission generally requires large institutional investment managers to file quarterly reports listing their holdings.
Through the years, despite Mr. Buffett’s admonitions not to do so, many people have tried to mirror his strategy as it is revealed on the Berkshire Hathaway Form 13F filed with the S.E.C. Because Mr. Buffett presents himself as a long-term value investor, investors may think it doesn’t matter that this filing may be months out of date. But not understanding exactly how he makes decisions, they don’t have his edge, must come to the party late and have frequently bid up prices as they compete against one another to buy the assets in his portfolio.
There is plenty of evidence of this: A 2008 study by Gerald S. Martin of American University and John Puthenpurackal of the University of Nevada, Las Vegas, found that when S.E.C. filings reveal changes in the Berkshire Hathaway portfolio, the stock prices of newly acquired companies had an abnormal one-day increase averaging 4 percent. Even so, they found long-lasting effects. A simulated replication strategy from 1976 through 2006 based on the S.E.C. filings outperformed the market by over 10 percent a year.
That was an amazing result, though merely copying Mr. Buffett has been less satisfying in recent years because his investment performance has dimmed somewhat. No one can excel all the time, and even a Buffett may produce in a lifetime no more than a few great ideas that may not be viable forever.
There are even bigger problems in replicating strategies extracted from the community of scholars who publish not only what they do, but why they do it.
For example, a much-talked-about paper by R. David McLean of Georgetown University and Jeffrey Pontiff of Boston College published last year pointed out that the effectiveness of stock market investing strategies seems to diminish, but not disappear, after publication.
The paper, which won the American Finance Association’s 2016 Amundi Smith Breeden Award, examined 97 financial patterns that appeared to predict investment returns and had been published in reputable scholarly journals and supported by tests that found statistical significance. Such strategies relied on factors like price-earnings ratios, changes in analyst recommendations, credit rating downgrades, stock price momentum, industry momentum and failure to pay dividends.
The researchers looked at the performance of each of these strategies, assuming you had started right after the publication of research papers on them and then continued for years. They found that while the strategies outperformed the market, their success decreased by more than 50 percent after publication.
In a follow-up paper, the two authors, along with Joseph Engelberg of the University of California, San Diego, showed that one-day positive surprises on firms’ earnings announcements accounted for nearly all of the investment’s total outperformance. Why? It appears to be because the market consistently makes mistaken valuations of corporate earnings, which tend to be corrected in stock prices only when the final earnings evidence is staring traders in the face.
So what’s an investor to do? Both published statistical analyses and published actions and opinions of knowledgeable people, whether geniuses or just smart and well-informed investors, are worth mulling over if you have a taste for such things. But don’t follow these strategies blindly. We need to exercise our intuitive judgment as well as rely on the wisdom of smart, well-informed people to decide whether to continue to rely on statistical indicators and investment strategies that seemed to work in the past.
The problem is that the world is too complex for any method to work all of the time. The economist Alfred Marshall, then of Cambridge University, wrote in his 1890 textbook “Principles of Economics”: “Although scientific machinery should be as definite as possible, at the same time it should be flexible.” He added, “There is so much variety in economic problems, economic causes are intermingled with others in so many different ways, that exact scientific reasoning will seldom bring us all the way to the conclusion for which we are seeking.”
His reasoning is still valid. We need to use statistical analysis but also respect human intuition and even genius if we are able to identify it. But do so with caution. No single strategy is likely to beat the market forever.
- Source: NY Times
Small and regular will yield results
If you are 5 or 45 years away from retirement, joining KiwiSaver is a ‘no brainer’ option.
There is the free $1,000 kick-start from the Government, which gets your KiwiSaver savings and compounding returns started immediately; member tax credits for contributing members aged between 18 and 65 years (currently up to a maximum of $521 per member per annum); and if you are over 18 your employer will match your contributions (the minimum now being 3 percent).
KiwiSaver is locked in until 65 meaning unless you use it to buy your first home or suffer hardship. This means that if you continue to contribute to it, your KiwiSaver Scheme Fund will be a nice little nest egg to supplement your NZ Superannuation when you decide to retire.
Other benefits are that you can easily transfer between KiwiSaver providers if you are not satisfied with your current KiwiSaver experience (whether for performance, reporting, change of ownership or other reasons); you can easily switch between funds staying with your same provider, eg from growth to balanced; and if you have lived overseas and have acquired a foreign pension or superannuation fund, you can transfer it into your KiwiSaver Scheme Fund (however, not all countries or KiwiSaver providers will allow transfers).
To simply depict how effective it is to join KiwiSaver:
If you are 20, just finished your tertiary education and earning $30,000, your annual KiwiSaver contribution (at the current minimum rate), will be $900, with your employer also contributing $900.
This will mean by the end of year 1, you will have a KiwiSaver balance of $2,800 without taking into account any growth (or fees). Your 45 years of KiwiSaver contributions, allowing for a 2% increase in salary each year, and an assumed net yield from your investment of 5% per annum, will give you $508,820 by age 65. It is important to note that these calculations do not take into account inflation - $500,000 in 45 years will not have the same spending power as $500,000 does now.

20 Years and above age with 30 K annual earnings
If you are 60, on a $80,000 salary, with 5 years left until NZ Superannuation kicks in, your annual KiwiSaver contribution (at the current minimum rate), will be $2,400, with your employer also contributing $2,400 each year. If we take into account your 5 years of KiwiSaver contributions, again allowing for 2% salary increases and a 5% net yield then you will have $33,229 at retirement age. Or you could up your contributions to the maximum rate of 8 percent with your employer’s still at 3 percent, and your KiwiSaver balance at 65 would be $57,337. Again, inflation is not taken into account in these calculations.
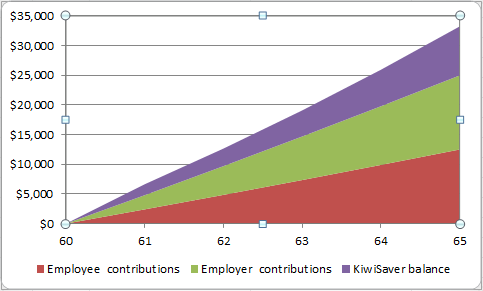
60 years and above with 80 K earnings
It sounds too easy, doesn’t it?
The key is that small and regular contributions make savings happen, and as they grow, the gains you make are re-invested in your KiwiSaver Scheme Fund and have a compounding effect, meaning your KiwiSaver investment gets bigger and bigger. Obviously, the rate of growth of your KiwiSaver investment depends largely on the type of fund you’re invested in which is usually decided by a couple of other factors like your appetite for risk, age and number of years until retirement, which will dictate the type of fund you invest in and the proportion of volatility it is exposed to. For example, a growth fund always has a greater proportion of equities compared to a conservative fund, which will be invested in more fixed interest and less equities. Therefore the growth rate of your KiwiSaver Scheme Fund will depend on how the fund is invested, the fees and if you’re entitled to tax member tax credits.
Meaning, it is never too late to join KiwiSaver and the sooner you start, the more you have to gain when you do decide to retire.
- Source: Outside the Flags, Dimensional Fund Advisers
Stewart Group secures access to US fund

Nick Stewart, Prof Ken French (Director, Dimensional) and Don Stewart
In a coup for Hawke's Bay, wealth and risk management specialist Stewart Group is now an asset consultant for Fidelity Life's KiwiSaver schemes that include Texas-based Dimensional Funds Advisors' (DFA) funds.
Dimensional is the eighth-largest fund adviser in the United States.
"The Asset Class Conservative Kiwi Fund and Asset Class Growth Kiwi Fund Asset with Dimensional's strategies are unique, giving everyday investors the opportunity to have to engineer from the best minds in modern finance within their own New Zealand-based investment," company director Nicholas Stewart said.
Once KiwiSaver members join the Fidelity KiwiSaver Scheme they can tailor their investment profile by blending holdings across up to four funds.
The biggest drawcard is expected to be the option of moving to the Asset Class Conservative Kiwi Fund and/or the Asset Class Growth Kiwi Fund having their KiwiSaver contributions invested mainly in DFA (Australia) funds.
"Dimensional funds are generally not accessible to mum and dad investors because the minimum investment level is too high and they are not open to the public," Stewart said.
"There are only a small number of DFA-accredited New Zealand financial advisers offering Dimensional funds - and none in the KiwiSaver market."
The Asset Class Funds will not charge performance fees.
"We believe fund performance is a result of market performance, not manager stock selection or market timing."
Stewart said KiwiSaver funds were closing because providers were seeking increased economies of scale "to make more money".
"We came about this not to make a dollar, we came about this because we wanted to do the best for our clients. And that's rather unique."
Stewart met DFA director and Ivy League professor Ken French 11 years ago while Stewart was a 25-year-old graduate, on holiday from his job at a merchant bank.
French's academic research has become the basis upon which Stewart bases investment strategies.
"I was in Canada skiing with a girlfriend and her family's wealth was managed by Dimensional," Stewart said.
"Her father said I think you need to talk to my adviser because there is a different way of thinking. The little boy from New Zealand was given an introduction - an introduction that is hard to quantify in terms of its value for me."
When KiwiSaver has launched five years ago, Stewart pitched the idea of Stewart Group tailoring its own KiwiSaver fund to his father and fellow director Donald.
"I said to him, 'we cannot give advice when we cannot put our hand on our heart and say it's perfect and aligns with our investment philosophy.' Which meant all of a sudden there was an area of the advice market that we were saying no to. You can't keep going like that - our clients need advice in certain areas.
"So we said if we can't get a product, we will make a product.
"A lot of the Dimensional guys had become friends, so when I put this into their world and said, gentlemen, I need you to help me to bring something better to New Zealand.
"We are from a small province that exports apples and lamb and we were asking for something pretty big.
"You can imagine the discussions in Austin, Texas, 'Hastings where?'."
The Americans came to the party, literally, at the Scots-themed launch on Friday in Hastings.
And why didn't Mr. Stewart mention the Canadian-girlfriend connection in his launch speech?
"Hell no, my wife was inside."
- Source: Patrick O'Sullivan, Hawke's Bay Today


